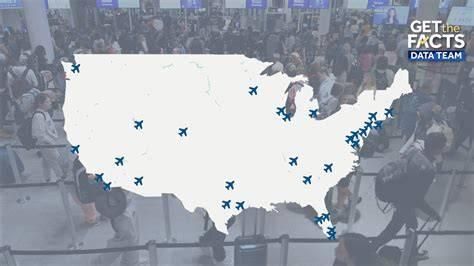
Flying out of a major American hub has become a calculated gamble: the walk from curb to gate is predictable, but the security queue is not. Data released by Travel Bulletin, drawn from the MyTSA app’s wait estimates between mid-June and mid-August, distills this uncertainty into something measurable. Across 50 airports surveyed during the peak summer rush, the average security wait was 9.9 minutes. But that national figure conceals a spread so wide it changes how travelers should plan every trip. At one end sits San Francisco International Airport, where passengers cleared security in a brisk 4.5 minutes. At the other sits John F. Kennedy International Airport, where the average wait ballooned to 23.1 minutes—more than five times longer than SFO’s. The ten busiest airports in the country, ranked below by average TSA wait time from longest to shortest, reveal a truth that frequent flyers have long suspected: volume alone does not determine delay, and the busiest airport in America is not the one with the worst line.
The 10 Busiest Airports Ranked by Average TSA Wait Time
The ranking, from longest average wait to shortest, reads as follows. JFK leads the pain with 23.1 minutes; Chicago O’Hare follows at 20.2 minutes; Newark Liberty lands third at 17.9 minutes; Hartsfield-Jackson Atlanta sits fourth at 14.1 minutes; Dallas-Fort Worth takes fifth at 13 minutes; Denver International comes in sixth at 12.6 minutes; Los Angeles International places seventh at 11.8 minutes; Boston Logan ranks eighth at 9.8 minutes; Orlando International is ninth at 9 minutes; and San Francisco finishes last—meaning best—at 4.5 minutes. Six of these ten airports beat the 9.9-minute national average; four trail it. The top three offenders alone—JFK, O’Hare, and Newark—average a combined 20.4 minutes, roughly double what travelers encounter in Boston or Orlando. What makes the spread more striking is that it does not track passenger volume. LAX, the busiest airport in the United States by hourly throughput, handles 4,305.9 passengers per hour, yet its wait ranks seventh among the ten. SFO, which processes 3,216.9 passengers per hour, ranks first in efficiency. Travel Bulletin’s modeling suggests every additional 1,000 passengers of capacity per hour adds roughly 2.3 minutes to wait time—a useful baseline, but one that multiple airports visibly defy.
Los Angeles International: America’s Busiest Airport With Surprisingly Manageable Lines
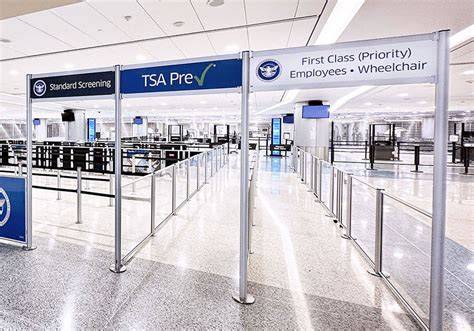
LAX processes more travelers per hour than any other American airport—4,305.9 passengers, edging out JFK’s 4,282 and O’Hare’s 4,216.7—so a 11.8-minute average wait is, by any fair measure, an operational achievement. It ranks seventh among the ten busiest airports, only a few minutes worse than the national norm. Yet travelers should read the average as a headline, not the whole story. Chase reports that LAX wait times can stretch to 25 minutes or more during peak hours: 6:30 AM to 9:00 AM for domestic departures, and 11:00 AM to 2:00 PM plus 8:00 PM to 11:00 PM for combined domestic and international flights. The evening window is especially punishing for international departures out of the Tom Bradley International Terminal, where long-haul banks collide. Standard guidance at LAX remains two hours early for domestic flights and three hours for international, but the airport has layered practical tools on top of that advice. The LAX Fast Lane pilot program lets travelers reserve a security screening time slot in advance, currently available for departures from Terminals 7 and 8. Parking can be pre-booked online, though travelers choosing economy lots should budget roughly ten minutes for the shuttle ride to their terminal.
John F. Kennedy International: Why New York’s Giant Has the Worst TSA Lines
JFK is the second-busiest airport in the United States and the worst performer among the ten, with an average of 23.1 minutes—more than double the national average of 9.9 minutes. The causes are structural rather than seasonal. A partial government shutdown this spring devastated airport security nationwide, and JFK ranked among the top five airports for TSA absences, with reported waits reaching an hour. The shutdown ended after 76 days in late April, when President Donald Trump signed a spending bill, but JFK’s security problems never fully receded. Much of the ongoing dysfunction traces to construction that has fallen behind schedule. The airport is redeveloping Terminal One into a facility with 13 gates, and its opening has been pushed into 2027, funneling international travelers into too few checkpoints. Construction has also reshuffled roadway patterns, with new highway split rules depending on terminal, alongside revised rideshare and pickup and drop-off policies. The consequence is a cascade: travelers hit unexpected road delays, arrive late, and rush the checkpoint in surges that overwhelm available lanes. One traveler bound for Madrid, Justin Swirvul, captured the mood for Spectrum News: “It looks long. I don’t know where the actual security line starts yet. It’s moving slowly, but it’s gonna be a long wait.”
San Francisco International: The Best TSA Performance by a Wide Margin
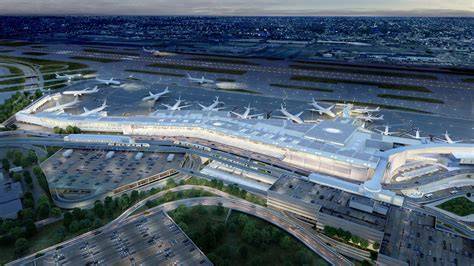
SFO delivered the fastest security experience in the country this summer, averaging 4.5 minutes—less than half the national norm and roughly one-fifth of JFK’s wait. Passengers at SFO frequently enter screening almost immediately after joining the queue. The airport’s advantage is not magic; it is structural. SFO participates in the TSA Screening Partnership Program (SPP), one of roughly 20 airports that rely on privately contracted screeners rather than federal TSA officers. At SFO, those screeners work for Covenant Aviation Security, are paid directly by the contractor rather than through the federal payroll, and operate under corporate logistics that allow staffing to flex quickly. When a bank of flights dumps passengers into the terminal, additional lanes can open within minutes rather than waiting on federal bureaucracy. Contractors can also negotiate wages, bonuses, and benefits to remain competitive in an exceptionally expensive Bay Area labor market. The model proved its worth during the spring shutdown, when SPP airports largely insulated themselves from the federal staffing crisis that hobbled facilities such as JFK. Tamara Gane’s reporting on the program underscores the core distinction: private screeners answer to a contract and a service-level agreement, not a government appropriations calendar.
Chicago O’Hare and Newark Liberty: The Congestion Penalty
Chicago O’Hare and Newark Liberty illustrate how raw congestion compounds operational strain. O’Hare, the third-busiest airport in the country at 4,216.7 passengers per hour, posted the second-longest wait among the ten at 20.2 minutes. Newark, the seventh-busiest at 3,039.5 passengers per hour, ranked third at 17.9 minutes—nearly twice the national average despite processing fewer travelers per hour than Atlanta, Denver, Dallas-Fort Worth, or San Francisco. Newark’s poor showing relative to its modest throughput suggests that staffing and lane availability, not passenger count, drive the outcome. The pattern repeats across the ranking: airports with disciplined staffing models consistently outperform busier peers, while those with constrained checkpoints absorb delays out of proportion to their traffic.
Atlanta, Denver, and Dallas-Fort Worth: The Middle Tier
Hartsfield-Jackson Atlanta, the fourth-busiest airport at 3,753.8 passengers per hour, recorded an average of 14.1 minutes—fourth longest among the ten. Denver International, processing 3,320.5 passengers per hour, posted 12.6 minutes, sixth longest. Dallas-Fort Worth, at 3,230.7 passengers per hour, landed at 13 minutes, fifth longest. All three sit modestly above the 9.9-minute national average, consistent with high-volume hubs that manage congestion without the systemic disruptions seen in New York. Travelers through these airports should expect waits in the low-to-mid teens during peak periods but rarely the hour-long queues associated with JFK’s worst days.
Boston Logan and Orlando International: Under-Ten-Minute Outliers
The eighth- and ninth-busiest airports in the country both beat the national average comfortably. Boston Logan, processing 2,998.1 passengers per hour, averaged 9.8 minutes, essentially at the national norm. Orlando International, at 3,033.8 passengers per hour, averaged just 9 minutes, ranking ninth among the ten. Orlando’s performance is notable given its heavy leisure traffic, including families with children and infrequent flyers who typically slow screening throughput. Both airports demonstrate that sub-ten-minute averages are achievable even at scale when checkpoint capacity aligns with passenger demand.
Small Airports, Long Waits: Why Low Volume Does Not Guarantee Speed
Avoiding America’s busiest airports does not guarantee a fast line. Ted Stevens Anchorage International Airport averaged 16.3 minutes despite processing only 516.7 passengers per hour—a wait longer than LAX’s, Denver’s, or Dallas-Fort Worth’s. Technology failures compounded the problem: in May, less than a month after the shutdown ended, Anchorage experienced intermittent outages with its X-ray screening equipment. Airport spokesperson Lex Yelverton advised passengers to arrive two to three hours before departure, telling Alaska Public Media: “TSA is actively working to address the current situation. However, extended wait times are expected to persist throughout the day and may continue through Friday.” Other quieter airports show similar strain. Portland International averaged 13.4 minutes at 1,172.6 passengers per hour; Dallas Love Field averaged 11.1 minutes at 679.8; San Diego International averaged 13.2 minutes at 1,727.4; Tampa International averaged 12.7 minutes at 1,578; and Sacramento International averaged 10.6 minutes at 864.9. None approaches the throughput of the ten busiest hubs, yet all post waits comparable to or worse than LAX’s.
Privatization and the Future of TSA Screening
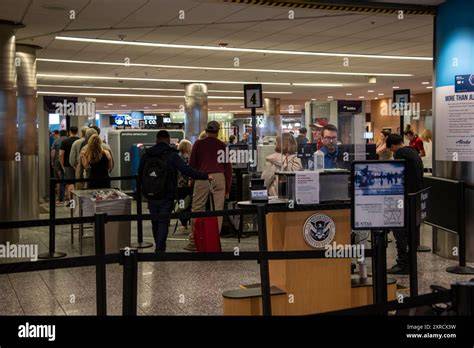
After this spring’s chaos, the SPP model has become the central policy question in American airport security. President Trump’s FY 2027 budget proposed cutting 9,400 TSA personnel and replacing them with privatized screening. The TSA itself has moved toward privatization through its Horizon 25 strategy, launched this summer, which promises to “accelerate public-private partnerships.” Similar efforts through the TSA Gold+ program were scrapped partly due to union opposition. Critics argue that competition would degrade working conditions and security effectiveness. Senator Andy Kim told the US Senate Committee on Commerce, Science and Transportation that “these proposals would hurt the very workforce dedicated to the security of the traveling public each day. Private contractors answer to the bottom line, incentivizing them to cut labor costs. And TSA’s privatization push is built on offloading its highest expenditure—personnel compensation and benefits.” Kim also invoked the agency’s founding mission of centralizing airport security standards after the September 11 attacks, arguing that mission remains relevant today. SFO’s results offer the strongest empirical counterpoint, but whether one airport’s success with private screeners can scale to fifty remains the unresolved question at the heart of the debate.