American Airlines commands a towering presence in global aviation, moving over 224 million passengers in 2025 and maintaining its status as the largest carrier in the United States by domestic traffic. Yet beneath this scale lies a fascinating contradiction: a handful of routes struggled so dramatically that they flew with barely a fraction of their seats filled. These underperforming routes reveal far more than weak demand—they expose strategic gambles, competitive pressure, and the delicate economics of airline scheduling.
The Reality Behind Load Factors and Network Strategy
Load factor, the percentage of seats filled on a flight, is one of the clearest indicators of airline performance. In 2025, American Airlines posted a respectable 83.6% average load factor, outperforming United Airlines but narrowly trailing Delta Air Lines. On paper, that suggests a well-optimized network. In practice, however, averages often conceal extremes.
Some routes were thriving, packed with passengers and generating strong yields. Others, however, were startlingly empty—operating at levels that would raise eyebrows even in experimental route planning. These low-performing routes weren’t necessarily failures in isolation; many were driven by broader strategic goals such as slot retention, market testing, or competitive positioning.
New York JFK to Worcester: The 18% Load Shock
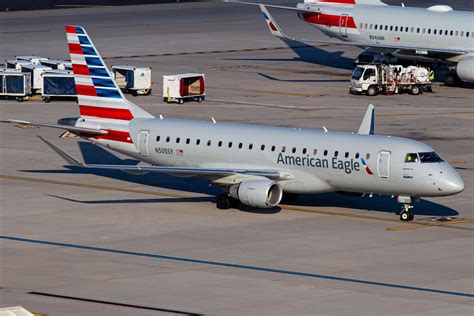
The most striking example came from the ultra-short hop between New York JFK and Worcester, which recorded an astonishing 18% average load factor. That translates to roughly 14 passengers on a 76-seat Embraer E175, an almost surreal figure in modern aviation.
This route, spanning just 130 nautical miles, wasn’t designed for profitability. Instead, it functioned largely as a slot-sitting operation, allowing American Airlines to maintain valuable takeoff and landing rights at JFK. With such strategic motives, passenger demand became secondary.
Despite operating daily, the route never gained traction. Monthly performance was consistently poor, dipping to as low as 12 passengers per flight in June. Unsurprisingly, the route was discontinued in July 2025, marking the end of one of the emptiest scheduled air services in recent memory.
Emerging Routes and Overcapacity Pressures
Beyond Worcester, several routes struggled due to market miscalculations and excess capacity. The route between Phoenix and Santa Maria achieved only 40.9% load factor, despite being a newly introduced service. While new routes often require time to mature, this one never found its footing.
Similarly, New York JFK to Saint Vincent posted a modest 44.5% load factor, reflecting the challenges of entering a market suddenly flooded with competition. The arrival of multiple carriers—including JetBlue and Caribbean Airlines—dramatically increased available seats to the Caribbean destination.
This surge in capacity outpaced demand, creating a textbook case of oversupply in a niche leisure market. While the route continues seasonally, its long-term sustainability remains uncertain.
Regional Connectivity vs. Demand Reality
Short-haul domestic routes also featured prominently among the least-filled services. Flights like Chicago O’Hare to Waterloo and LaGuardia to Dayton hovered below the 50% mark, revealing a deeper issue in regional connectivity.

These routes often serve smaller cities with limited demand, yet they play a critical role in feeding passengers into larger hubs. The problem arises when connecting traffic fails to materialize in sufficient numbers, leaving aircraft underutilized.
In the case of LaGuardia to Dayton, the route was eventually discontinued, leaving Dayton without direct service to the New York area. This underscores a recurring theme: not all connectivity can be sustained purely for network completeness.
Capacity Decisions That Backfired
One of the most instructive examples comes from LaGuardia to Sarasota, a route that initially performed well with smaller regional aircraft. Load factors once reached over 90%, indicating strong demand relative to capacity.
However, American Airlines made a bold move by upgrading the route to larger Airbus A320 aircraft and increasing frequency. The result? A dramatic drop in load factor to as low as 43.8%.
This case highlights a crucial airline principle: capacity discipline matters as much as demand itself. Increasing seat supply without proportional demand growth can quickly erode performance, even on previously successful routes.
The Middle Tier of Underperformance
Routes such as Charlotte to Florence, Los Angeles to Vail, and Miami to Harrisburg occupied the middle ground, with load factors hovering around the 50% range. These weren’t catastrophic failures, but they still fell significantly short of network averages.
These routes often cater to seasonal or niche demand, such as ski travel to Vail or regional business traffic. Their performance fluctuates heavily depending on time of year, economic conditions, and competing travel options.

In such cases, airlines must carefully balance frequency, aircraft size, and seasonal scheduling to avoid persistent underperformance.
Why Airlines Operate Low-Fill Routes
At first glance, operating flights with half-empty cabins—or worse—may seem irrational. In reality, these decisions are often deliberate. Airlines may maintain such routes to:
- Protect valuable airport slots at congested hubs
- Test new markets before committing long-term
- Deter competitors from entering strategic routes
- Support broader network connectivity
These factors mean that profitability isn’t always measured route-by-route. Instead, airlines evaluate performance across the entire network ecosystem.
What These Routes Reveal About Airline Strategy
The emptiest routes in American Airlines’ network offer a rare glimpse into the complex balancing act of modern aviation. Success isn’t just about filling seats—it’s about aligning capacity, competition, and long-term strategy.
Some routes failed because demand simply wasn’t there. Others suffered from overambitious capacity increases or sudden competitive shifts. And a few existed primarily for strategic reasons, where low passenger numbers were an accepted trade-off.
What emerges is a nuanced picture: even the world’s largest airline must constantly experiment, adjust, and sometimes retreat.
The Bottom Line: Empty Seats, Full Lessons
American Airlines’ least-filled routes in 2025 are more than statistical outliers—they are case studies in aviation economics and strategic decision-making. From an 18% load factor shock to routes undone by their own expansion, each tells a story of risk, ambition, and adaptation.
For travelers, these routes may seem invisible. For the airline industry, however, they are invaluable learning tools—reminders that even in a data-driven world, predicting demand remains as much an art as it is a science.


