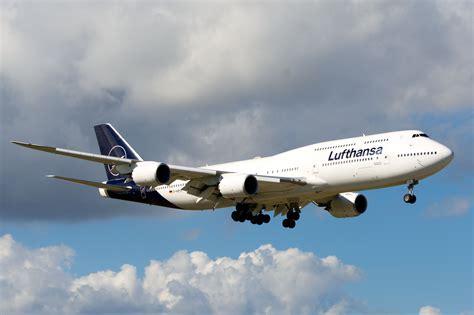
Lufthansa remains a powerhouse in transatlantic aviation, yet even industry giants reveal vulnerabilities when demand patterns shift. Between February 2025 and January 2026, the airline transported 5.6 million passengers between Europe and the United States, marking its fifth-strongest annual performance on record. Still, this figure sits 11% below pre-pandemic levels, signaling that recovery has not been evenly distributed across its network.
Despite ranking as the fifth-largest Europe–US carrier, Lufthansa commands only 7% of the total market share—roughly one in every fourteen passengers crossing the Atlantic. That’s respectable, but in a fiercely competitive landscape dominated by Delta, United, American Airlines, and British Airways, even small inefficiencies become highly visible.
The airline’s 83.6% average load factor suggests overall stability. Yet averages can be deceptive. Beneath this headline figure lies a cluster of routes where empty seats significantly outnumber expectations, offering a revealing look into network strategy, aircraft deployment, and evolving passenger demand.
Frankfurt to Minneapolis: The Most Underwhelming Route
The weakest link in Lufthansa’s US network is unmistakable. The Frankfurt–Minneapolis route posted a strikingly low 56.1% load factor, making it the least efficient route in the airline’s portfolio.
This wasn’t simply a case of weak demand. The route operated only between June 2024 and April 2025, limiting its ability to mature. Over that period, just 13,517 round-trip passengers were carried—an unusually low figure for a transatlantic service.
Interestingly, the route transitioned to Discover Airlines, Lufthansa Group’s leisure-focused subsidiary. Under Discover, the same route achieved a 77.9% load factor, albeit with seasonal scheduling rather than year-round service. This shift highlights a crucial insight: matching capacity and business model to demand is often more important than the route itself.
Munich’s Struggles: A Hub Under Pressure
A clear pattern emerges among Lufthansa’s weakest routes—Munich dominates the list. Four of the bottom five routes originate from Bavaria’s capital, underscoring structural challenges at the airline’s secondary hub.
- Munich–Boston: 74.0% load factor
- Munich–Seattle: 75.6% load factor
- Munich–San Francisco: 76.3% load factor
- Munich–Washington Dulles: 76.8% load factor
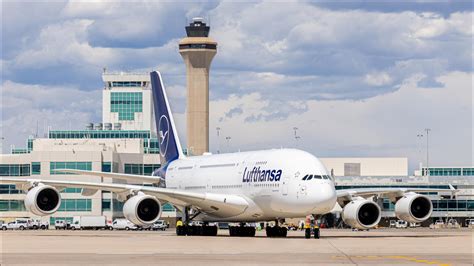
While these numbers are not disastrous, they fall well below optimal levels for long-haul profitability. The underlying issue is not demand alone but capacity strategy. Munich flights average 343 seats per departure, compared to 310 from Frankfurt, largely due to the deployment of larger aircraft like the Airbus A380.
The use of high-capacity aircraft depresses load factors even when passenger numbers remain strong. For example, the Munich–Washington Dulles route saw reduced seat occupancy after switching to the 509-seat A380, yet likely generated higher total revenue per flight.
Seattle stands out as a newer addition, launched just two years ago. New routes typically require time to mature, suggesting its relatively weak performance may improve as awareness and demand build.
Mid-Tier Underperformers Reveal Strategic Trade-Offs
Beyond the bottom five, Lufthansa’s sixth to tenth weakest routes provide deeper insight into the airline’s balancing act between growth and efficiency.
- Munich–Denver: 77.6%
- Frankfurt–Atlanta: 78.9%
- Frankfurt–Boston: 80.0%
- Munich–Los Angeles: 80.5%
- Frankfurt–Seattle: 82.4%
Among these, Munich–Denver is particularly revealing. Passenger numbers surged by 25% year-over-year, yet the load factor dropped due to the introduction of the A380, which dramatically increased seat supply.
In response, Lufthansa has already reduced A380 deployment on this route in 2026, cutting capacity by 6% annually. This demonstrates a proactive approach: adjust supply before profitability erodes further.
Meanwhile, routes like Frankfurt–Boston and Munich–Los Angeles hover around the 80% mark—respectable but still below the airline’s system-wide average. These routes likely remain profitable but lack the margin strength of top-performing corridors.
New Routes Are Quietly Outperforming Expectations
While some legacy routes struggle, newer destinations are showing encouraging resilience. Notably, none of the recently launched routes appear among the bottom ten.
- Frankfurt–Raleigh/Durham: 82.6% load factor
- Munich–San Diego: 84.2% load factor
- Frankfurt–St. Louis: 88.1% load factor
These figures suggest Lufthansa’s network expansion strategy is not inherently flawed. In fact, newer routes may benefit from untapped demand, less competition, and more tailored capacity planning.
The St. Louis route, in particular, stands out with a strong 88.1% load factor, indicating robust demand. However, competitive pressure is looming, as British Airways plans to enter the market, potentially forcing Lufthansa to increase frequencies and adjust pricing strategies.
The Bigger Picture: Load Factor Isn’t Everything
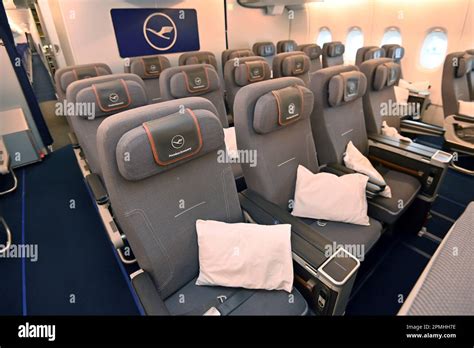
It’s tempting to interpret lower load factors as failure, but that would miss the nuance. Airlines often accept lower seat occupancy in exchange for higher yields, especially on premium-heavy routes or those served by larger aircraft.
Lufthansa’s overall performance—slightly above the transatlantic average of 83.1%—indicates that its network remains fundamentally sound. Even so, the disparity between Frankfurt and Munich (85.4% vs. 81.1% average load factors) highlights how hub dynamics and fleet decisions shape outcomes.
The broader takeaway is clear: route performance is a complex equation involving demand, aircraft size, competition, and timing. Lufthansa’s emptiest US routes are not simply weak—they are strategic experiments, capacity mismatches, or transitional services adapting to a changing market.
And in aviation, today’s underperformer can quickly become tomorrow’s success story with the right adjustments.


