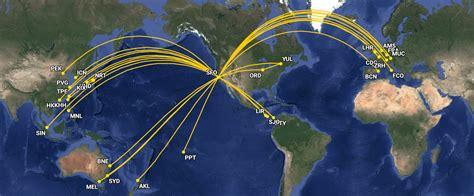
United Airlines stands as the undisputed heavyweight of long-haul aviation in the United States, moving a staggering 20.9 million intercontinental passengers in 2025. Yet behind this impressive scale lies a surprising contradiction: some of its longest routes are flying with barely half their seats filled. The numbers reveal a deeper story—not of failure, but of strategic experimentation, shifting demand, and the harsh economics of global aviation.
Despite long-haul traffic representing just 11.5% of United’s total passengers, the airline continues to aggressively expand and test new markets. Compared to competitors like American Airlines and Delta Air Lines, United has leaned more heavily into international flying, pushing boundaries that sometimes result in underwhelming load factors.
Understanding the 52% Reality: When Planes Fly Half Empty
At first glance, a 52.3% load factor—as seen on the San Francisco to Panama City route—might seem alarming. But aviation economics are rarely that simple. Load factor measures how full a plane is, not how profitable a route may be. Premium cabin sales, cargo revenue, and long-term network positioning often outweigh short-term seat occupancy.
Still, the data from the US Department of Transportation paints a clear picture: United’s average long-haul load factor sat at 81.0%, but several routes fell dramatically below that benchmark. These underperformers are not random—they reflect new market entries, seasonal demand fluctuations, and strategic gambles.
The 10 Emptiest Long-Haul Routes Revealed
United’s least-filled long-haul routes in 2025 expose a pattern of experimentation and recalibration. The weakest performers include:
- San Francisco – Panama City: 52.3%
- Washington Dulles – Dakar: 55.8%
- Newark – Tenerife South: 61.6%
- Los Angeles – London Heathrow: 63.8%
- Los Angeles – Hong Kong: 67.2%
- San Francisco – Adelaide: 68.5%
- Houston – Sydney: 69.0%
- Houston – London Heathrow: 69.1%
- Washington Dulles – Amsterdam: 69.6%
- San Francisco – Amsterdam: 70.3%
While these figures may appear underwhelming, they reveal something more important: United is actively probing underserved or volatile markets, even at the cost of short-term inefficiency.
Transatlantic Dominance—and Weakness
A striking trend emerges from the data: six of the ten weakest routes are transatlantic. This reflects both the scale and saturation of North Atlantic travel. Even as demand rebounds globally, competition across this corridor remains fierce.
Routes like Washington Dulles to Amsterdam and Houston to London Heathrow highlight how capacity often outpaces demand, especially when multiple airlines flood the same market. Interestingly, this mirrors trends seen at Delta, where most low-performing routes also cross the Atlantic.
The lesson is clear: even the world’s busiest aviation corridors can become overcrowded battlegrounds, where airlines sacrifice load factors to maintain market presence.
The Dakar Experiment: A Case Study in Rapid Exit
Perhaps the most telling example is the short-lived Washington Dulles to Dakar route. Launched with optimism, the service lasted less than a year before being discontinued. Despite operating just three weekly flights on a Boeing 767-300ER, the route struggled to build sustainable demand.
Dakar has long been a challenging market for US carriers. Previous attempts by airlines like South African Airways and Air Senegal failed to establish lasting connections to the United States.
United’s entry added competition against Delta Air Lines, which already served the region via New York. Meanwhile, Canadian leisure carrier Air Transat has targeted Dakar from Montreal, focusing on more favorable diaspora and leisure traffic flows.
The outcome underscores a harsh truth: not all emerging markets can sustain direct long-haul service, even with limited frequency.
Los Angeles to London: A Surprising Underperformer
Among all the routes listed, one stands out as particularly shocking: Los Angeles to London Heathrow Airport. This is one of the busiest intercontinental corridors in the world, handling nearly 1.5 million passengers annually across all airlines.
Yet United’s performance on this route was unexpectedly weak, with a 63.8% load factor—its lowest in over three decades. Several months dipped below 50%, including a striking 41.5% in February 2025.
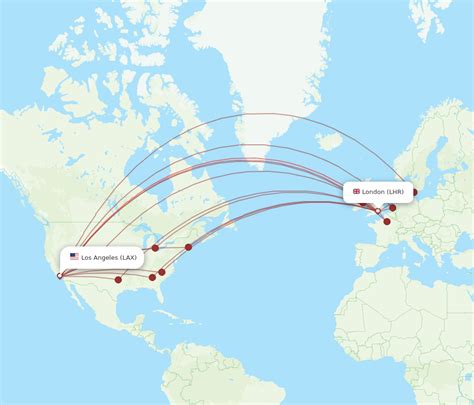
The explanation lies in capacity adjustments and competitive pressure. United reduced its frequency from double daily flights in 2024 to a single daily service in 2025. However, demand declined slightly faster than capacity, dragging down the load factor.
This scenario illustrates a key aviation paradox: even in high-demand markets, timing, pricing, and competition can dramatically impact performance.
Asia-Pacific and Ultra-Long-Haul Challenges
Routes such as Los Angeles to Hong Kong and Houston to Sydney reveal another layer of complexity. These ultra-long-haul flights are highly sensitive to geopolitical factors, business travel trends, and aircraft utilization.
United’s Hong Kong service, for instance, has evolved into multi-destination operations extending to Southeast Asia, reflecting a shift toward network optimization rather than point-to-point demand.
Meanwhile, newer routes like San Francisco to Adelaide—launched late in 2025—naturally show lower load factors due to their infancy. Early performance metrics often underrepresent a route’s long-term potential.
Strategic Growth Over Short-Term Perfection
What appears to be inefficiency is, in reality, a calculated strategy. United is leveraging its scale to test new markets, maintain global connectivity, and position itself ahead of competitors.
Low load factors on certain routes do not necessarily signal failure. Instead, they represent investment phases, where airlines absorb short-term losses to secure long-term gains. Routes may be adjusted, re-timed, or even canceled—but each experiment contributes valuable data.
In a world where aviation demand is constantly shifting, flexibility is more valuable than perfection.
The Bigger Picture: Why Empty Seats Matter Less Than You Think
The headline figure—only 52% full—grabs attention, but it tells just one part of the story. Airlines operate within a complex ecosystem where profitability depends on multiple variables beyond seat occupancy.
Cargo demand, premium cabin yields, alliance partnerships, and hub connectivity all play critical roles. United’s willingness to tolerate lower load factors on certain routes reflects a broader ambition: to dominate global long-haul travel, even in uncertain conditions.
Ultimately, these “emptiest” routes are not signs of weakness—they are evidence of a carrier pushing the boundaries of its network, adapting in real time, and shaping the future of international aviation.


