Delta Air Lines stands as one of the most dominant forces in the United States aviation industry. Carrying over 201 million passengers in 2025, the airline transported an average of 551,000 travelers every day, capturing 18.2% of total U.S. passenger traffic. Within the domestic market, Delta’s share climbed to over 20%, placing it just behind American Airlines.
Despite this enormous scale, even the most successful airline networks include routes that struggle to fill seats. Data from the U.S. Department of Transportation (DOT) reveals that while Delta maintained a strong average network load factor of 83.7% in 2025, several routes performed dramatically below this benchmark. Some flights operated with less than half of their seats filled, and one route averaged just 29.3% capacity.
Understanding why these routes exist—and why many continue to operate—offers a fascinating look into regional connectivity programs, airline strategy, and airport economics.
Understanding Delta’s Network Performance and Load Factors
Load factor is one of the most important metrics in aviation. It measures the percentage of available seats that are actually occupied by passengers. For airlines like Delta, which operate thousands of daily flights, even small shifts in this metric can significantly impact profitability.
In 2025:
- Overall network load factor: 83.7%
- Domestic load factor: 83.2%
- International load factor: 84.8%
These figures reflect a highly efficient network overall. However, averages conceal extreme outliers. Certain routes—especially those serving small regional airports—operate with much lower demand but remain strategically important.
Many of these flights exist thanks to the Essential Air Service (EAS) program, a U.S. government initiative designed to maintain air connectivity for smaller communities that would otherwise lose commercial service.
Without these subsidies, most of the routes listed below would likely disappear entirely.
The 10 Delta Routes With the Lowest Passenger Load Factors
DOT statistics reveal the following ten Delta Air Lines routes with the lowest seat occupancy in 2025:
- Minneapolis – Watertown: 29.3% load factor
- Minneapolis – Hibbing: 35.8%
- Salt Lake City – Cedar City: 37.4%
- Austin – Harlingen: 41.3%
- Minneapolis – Escanaba: 41.4%
- Detroit – Alpena: 41.6%
- New York LaGuardia – Worcester: 43.5%
- Minneapolis – International Falls: 44.1%
- Washington Reagan – Lexington: 47.6%
- Minneapolis – Brainerd: 48.2%
These figures represent full-year averages, meaning that on many departures fewer than half the seats were filled.
The most extreme case—Minneapolis to Watertown—recorded a 29.3% load factor, meaning the aircraft was less than one-third full on average throughout the year.
Why Essential Air Service Routes Often Appear Empty
At first glance, such numbers might suggest severe operational inefficiency. In reality, many of these flights serve small regional communities where passenger demand alone cannot sustain regular air service.
The Essential Air Service program, created after airline deregulation in 1978, ensures that remote U.S. towns remain connected to the national air transportation network. Airlines receive subsidies to maintain service, allowing communities access to major hubs such as Minneapolis, Detroit, or Salt Lake City.
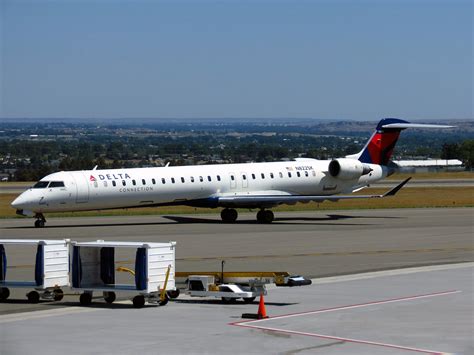
For Delta, these routes are usually operated by regional partners like SkyWest or Endeavor Air, flying smaller aircraft such as the CRJ900 or Embraer E175.
Even with subsidies, these flights rarely achieve high load factors because the local populations are small and travel demand fluctuates significantly.
The Minneapolis Hub and Its Cluster of Low-Demand Routes
A striking pattern in the data is the dominance of Minneapolis–Saint Paul International Airport (MSP) among the lowest-performing routes. Five of the ten emptiest flights originate from this hub.
These include connections to:
- Watertown, South Dakota
- Hibbing, Minnesota
- Escanaba, Michigan
- International Falls, Minnesota
- Brainerd, Minnesota
Delta’s Minneapolis hub functions as a critical regional gateway, feeding passengers from small Midwestern communities into the airline’s broader domestic and international network.
Although flights from these towns may depart with modest passenger counts, their value lies in connecting travelers to hundreds of onward destinations worldwide.
Austin–Harlingen: The Only Route That Disappeared
Among the ten lowest load factors, Austin to Harlingen stands out because it was not subsidized and ultimately ceased operations in June 2025.
The intrastate route covered just 237 nautical miles (439 km) and was operated exclusively by SkyWest Airlines using Embraer E175 regional jets. Despite Delta’s aggressive expansion in Austin—where it transported 3.7 million passengers in 2025—this specific route struggled to gain traction.
Interestingly, DOT data revealed that 54% of passengers connected through Austin, while 46% were local travelers. That mix suggested moderate connectivity demand but insufficient volume to sustain daily operations.
With Delta continuing to expand Austin capacity by roughly 15% in 2026, the airline appears focused on stronger routes and international growth opportunities rather than maintaining marginal domestic links.
LaGuardia to Worcester: A Curious Case of Persistence
Another intriguing entry is New York LaGuardia to Worcester, Massachusetts, which posted a 43.5% load factor in 2025.
The route spans only 127 nautical miles (235 km) and has operated since August 2019—a surprisingly long tenure given its weak performance.
Flights are typically operated by Endeavor Air CRJ900 aircraft, each with approximately 70 seats. With an average load factor of 43.5%, only around 30 seats were filled per departure.
Scheduling may play a role in the route’s limited demand. In 2025, departures left LaGuardia in the early afternoon and returned from Worcester later the same afternoon, a timetable that offered limited flexibility for business travelers.
Some analysts suggest the route may partially function as a “slot-sitting” operation, allowing Delta to maintain valuable takeoff and landing rights at LaGuardia, one of the most slot-restricted airports in the United States.

Strategic Value Beyond Passenger Numbers
Low load factors do not automatically signal failure. For large network airlines like Delta, routes often serve broader strategic purposes:
- Maintaining hub connectivity for remote communities
- Preserving airport slots at constrained airports
- Feeding passengers into long-haul routes
- Supporting regional economic development
Even when individual flights appear lightly filled, their presence can strengthen the overall network’s connectivity and competitiveness.
Delta’s Network Remains Strong Despite Outliers
The existence of a handful of underperforming routes does little to undermine Delta’s overall performance. With over 83% average load factors across its global network, the airline continues to operate one of the most efficient and expansive route systems in North America.
Instead, these empty flights illustrate the complex balancing act of modern airline network planning. Between government-subsidized regional connectivity, hub-and-spoke logistics, and competitive airport strategies, some routes inevitably fly with empty seats.
Yet those same flights ensure that even small towns remain connected to the global aviation system, reinforcing Delta Air Lines’ role as a national and international transportation backbone.
FAQs
What was Delta Air Lines’ average load factor in 2025?
Delta recorded an average seat load factor of 83.7% across its entire network in 2025, with 83.2% on domestic routes and 84.8% on international flights.
Why do some Delta routes have such low passenger numbers?
Many of these routes operate under the Essential Air Service (EAS) program, which subsidizes flights to small or remote communities that cannot sustain commercial service on their own.
Which Delta route had the lowest load factor in 2025?
The Minneapolis–Watertown route recorded the lowest performance, averaging just 29.3% seat occupancy throughout the year.


