
The Japan–US aviation market in 2026 is not merely competitive; it is strategic, symbolic, and immensely profitable. The transpacific corridor linking Tokyo, Osaka, and Nagoya with cities such as New York, Los Angeles, Chicago, and Honolulu remains one of the most resilient long-haul markets in global aviation. With approximately 1.6 million people of Japanese heritage living in the United States, alongside sustained business ties, tourism flows, and corporate travel demand, every departure across the Pacific carries weight. At the center of this rivalry stand All Nippon Airways (ANA) and Japan Airlines (JAL)—two legacy carriers representing different alliances, philosophies, and fleet strategies.
While both airlines operate overlapping routes, their execution diverges in meaningful ways. Capacity allocation, aircraft choice, alliance leverage, and airport strategy all shape who truly dominates the Japan–US market in 2026. The numbers tell one story; network architecture tells another.
ANA’s Tokyo-Centric Strategy: High Capacity, Focused Precision
ANA’s approach to the United States remains unmistakably Tokyo-centric. Every one of its US-bound services originates from either Tokyo Haneda (HND) or Tokyo Narita (NRT). According to Cirium’s March 2026 schedule data, ANA operates 465 one-way departures, offering 118,358 seats across its US network. That translates to an average of approximately 254 seats per flight, a figure that reveals the carrier’s commitment to density and scale.
Its flagship routes include twice-daily services from Haneda to New York JFK and Los Angeles LAX, alongside strong frequencies to Chicago O’Hare, San Francisco, Seattle, Houston, Washington Dulles, and Honolulu. Narita supplements this network with services to Chicago, Los Angeles, San Francisco, and Honolulu. The structure is deliberate: concentrate traffic through Tokyo’s twin hubs, maximize connectivity, and funnel passengers into Star Alliance partner networks.
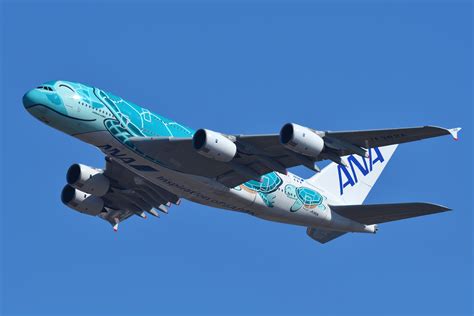
The aircraft selection reinforces this strategy. ANA deploys the Boeing 777-300ER, 787-8, 787-9, and the Airbus A380, with the latter primarily serving Honolulu. The A380, configured for high-capacity leisure demand, significantly boosts ANA’s average seat count. It is a bold move in an era when many airlines have retreated from superjumbos, but on Japan–Hawaii routes, the demand profile justifies the scale.
Beyond fleet choices, ANA has invested in brand visibility in the United States, including high-profile sports partnerships such as with the Los Angeles Dodgers. This strategy positions ANA not just as a transportation provider, but as a cultural bridge reinforcing Japanese presence in key American markets.
JAL’s Multi-Hub Expansion: Breadth Over Density
If ANA represents concentrated power, JAL embodies network diversity. In March 2026, Japan Airlines schedules 545 one-way US departures, offering 121,319 seats—a larger total than ANA. However, JAL’s average seats per flight stand at roughly 223, noticeably lower than its rival. This is not weakness; it is configuration strategy.
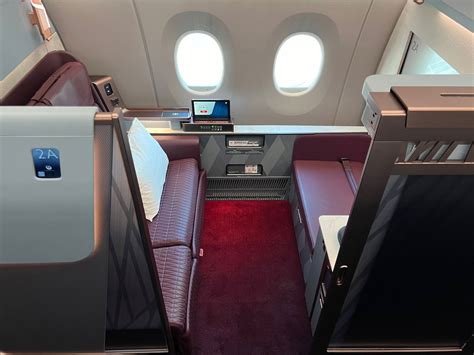
JAL’s long-haul cabins skew heavily toward premium seating. The airline’s Airbus A350-1000, now a centerpiece of its US operations, features cutting-edge business and first-class products that prioritize yield over raw seat count. The Boeing 787-9 dominates the schedule with 273 departures, supported by the A350-1000, 777-300ER, 767-300ER, and 787-8. The result is a fleet optimized for efficiency and high-margin passengers rather than maximum density.
JAL’s geographic footprint is broader than ANA’s. While Tokyo Narita anchors routes to Boston, Chicago, Guam, Honolulu, Los Angeles, San Diego, San Francisco, and Seattle, Haneda handles Chicago, Dallas/Fort Worth, Honolulu, Los Angeles, New York, and San Francisco. Importantly, JAL also operates from Osaka Kansai (KIX) to Honolulu and Los Angeles, and from Nagoya (NGO) to Honolulu. This multi-airport strategy gives JAL access to regional demand that bypasses Tokyo entirely.
The inclusion of Dallas/Fort Worth stands out. As a fortress hub for American Airlines, JAL’s oneworld partner, this route demonstrates alliance logic at work. By contrast, ANA leverages Star Alliance ties with United Airlines, explaining its exclusive presence in Houston and Washington Dulles, both critical United hubs. In transpacific aviation, alliances are not marketing slogans; they are structural forces shaping route maps.
Capacity vs. Control: Who Really Leads?
On pure departure count and total seats in March 2026, JAL holds the edge. It operates more flights and offers slightly more seats overall. That metric alone suggests dominance. Yet the narrative complicates when average seat density enters the equation. ANA’s use of larger aircraft, particularly the A380, means that in certain months—February being one example—it can surpass JAL in total seat capacity despite operating fewer flights.
This difference highlights two strategic philosophies. ANA emphasizes high-capacity trunk routes, reinforcing Tokyo as the undisputed gateway between Japan and North America. JAL prioritizes network breadth and premium yield, capturing diverse city pairs and maximizing alliance feed.
Dominance, therefore, depends on the metric applied:
- Flight frequency leadership: JAL
- Total seats (March 2026): JAL
- Average seats per departure: ANA
- Geographic diversity within Japan: JAL
- Ultra-high-capacity leisure routes: ANA
The battle is not binary. It is layered.
Fleet Innovation and Competitive Positioning in 2026
The competitive atmosphere intensifies when fleet modernization enters the frame. JAL’s A350-1000 introduces advanced cabin design, enhanced privacy suites, and improved fuel efficiency. This aircraft positions JAL strongly in premium-heavy markets like New York and Los Angeles, where corporate contracts drive revenue.
ANA, meanwhile, leverages the efficiency of the 787 family while sustaining a differentiated leisure product to Hawaii via the A380. The Dreamliner’s economics allow ANA to maintain frequency while preserving margins on secondary routes such as Seattle and San Francisco.
Technological parity between the two airlines is striking. Both invest heavily in next-generation aircraft, both emphasize cabin refinement, and both maintain strong operational reputations. The contest is not about outdated fleets versus innovation; it is about deployment choices.
Alliance Dynamics and Market Power
The Japan–US market cannot be understood without examining alliance ecosystems. JAL’s alignment with American Airlines grants access to one of the largest domestic US networks, funneling passengers from cities far beyond coastal gateways. ANA’s partnership with United Airlines provides similar connective power through hubs like Chicago, Houston, and Washington.
These alliances influence scheduling, pricing coordination, and corporate contracts. A traveler flying from Osaka to Dallas benefits from JAL’s integration with American’s domestic web. A passenger connecting from Tokyo to a secondary US city via Houston leverages ANA’s partnership with United. The dominance question thus extends beyond Japanese carriers alone; it reflects alliance architecture spanning two continents.
The 2026 Verdict: A Market Split at the Top
In 2026, declaring a single undisputed champion oversimplifies a complex contest. Japan Airlines leads in flight volume and network breadth, projecting influence across multiple Japanese departure points and maximizing alliance connectivity. All Nippon Airways commands higher seat density and maintains formidable trunk-route strength, especially on high-demand corridors and leisure-heavy Hawaii services.
The Japan–US market is large enough to sustain two giants, each executing distinct strategies. JAL’s premium-centric diversification contrasts with ANA’s concentrated capacity muscle. The competition fuels innovation, cabin upgrades, and schedule expansion—benefiting travelers and reinforcing the transpacific corridor’s strategic significance.
The skies between Japan and the United States in 2026 are not controlled by a single flag carrier. They are shaped by two disciplined rivals pushing each other toward sharper efficiency and stronger global integration. In aviation, dominance is rarely permanent. It is measured in seats, frequencies, partnerships, and the quiet mathematics of demand crossing 5,000 miles of ocean every single day.
 Flights and Reviews: An In-Depth Look at Service, Comfort, and Controversy")


 Flights & Reviews: An In-Depth Look at Japan's Premier Airline")
