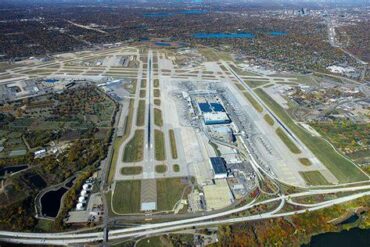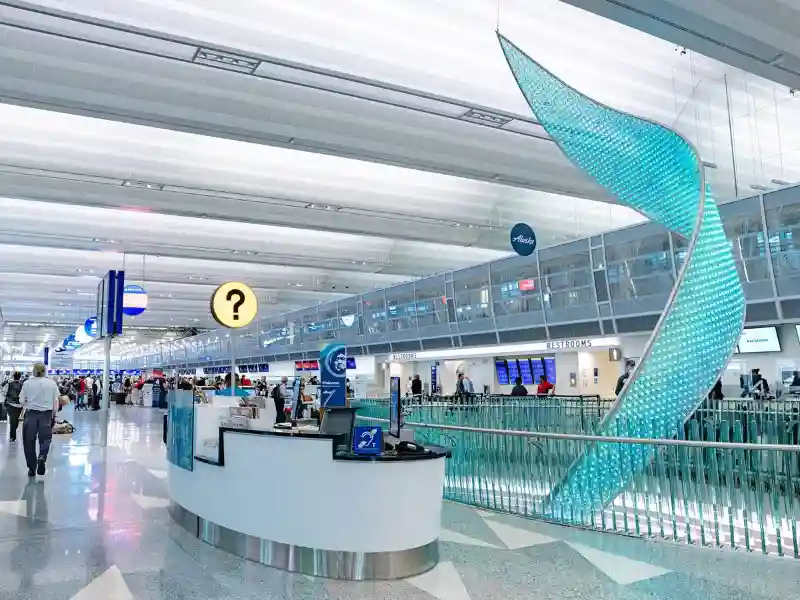
Minneapolis–St. Paul International Airport (MSP) has once again taken the top spot among North America’s Mega airports, earning the highest passenger satisfaction score in the 2026 J.D. Power North America Airport Satisfaction Study. With a score of 684 out of 1,000, MSP finished first in its category for the third consecutive year and the fourth time in five years, reinforcing its position as one of the continent’s strongest-performing major airport facilities.
The result is notable not simply because MSP retained its title, but because it achieved the highest position across all seven dimensions measured by J.D. Power. Those categories cover the full airport journey, from moving through the terminal and interacting with staff to using facilities, finding food and retail options, and completing both departure and arrival experiences. MSP therefore did not depend on one exceptional category to secure its position. Its performance was consistently strong across the passenger journey.
The 2026 study placed Detroit Metropolitan Wayne County Airport (DTW) second among Mega airports with 663 points, while Phoenix Sky Harbor International Airport (PHX) ranked third with 642. The Mega-airport segment averaged 617 points, meaning MSP finished 67 points above the category average and 21 points ahead of Detroit. At the other end of the table, Chicago O’Hare International Airport (ORD) and Newark Liberty International Airport (EWR) each recorded 585 points.
MSP Leads Every Major Passenger Satisfaction Category
The breadth of Minneapolis–St. Paul’s performance is perhaps more significant than the headline ranking itself. J.D. Power evaluated seven specific elements of the airport experience: ease of travel through the airport, trust in the airport, terminal facilities, airport staff, departure experience, arrival experience, and food, beverage and retail. MSP ranked first in every one of those dimensions.
That sweep gives the airport’s 684-point result additional context. A major connecting airport can perform strongly in one area while frustrating passengers elsewhere, particularly when large passenger volumes create congestion or when aging facilities struggle to keep pace with demand. MSP’s results indicate that travelers surveyed by J.D. Power experienced relatively strong performance across the different stages of their airport journey.
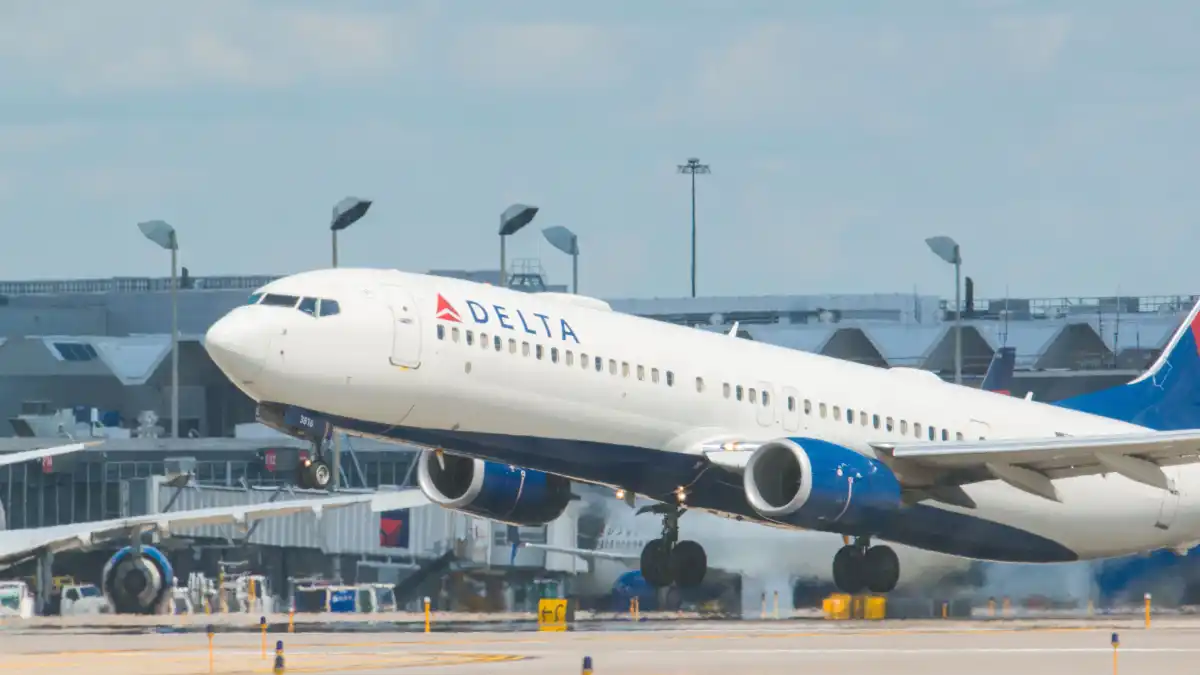
The airport’s scale makes the achievement especially notable. MSP handled approximately 36 million passengers in 2025, making it one of the busiest airports in the United States. It is also a major connecting point for Delta Air Lines, which operates its second-largest hub by seat capacity at Minneapolis–St. Paul. A facility handling tens of millions of travelers therefore has to maintain satisfaction while accommodating the complexity of a major airline hub.
Brian Ryks, CEO of the Metropolitan Airports Commission, which owns and operates MSP, described the repeated first-place result as an unprecedented achievement and attributed it to travelers’ appreciation of the airport’s service, hospitality and amenities. The comment reflects an important feature of the study: the ranking measures what passengers experience, rather than simply measuring an airport’s physical size, passenger volume or investment budget.
How J.D. Power Measured North America’s Airports
The 2026 J.D. Power study was based on 24,710 surveys collected between July 2025 and July 2026 from travelers who had recently used the airports included in the research. Respondents evaluated their airport experiences across the seven measured dimensions, with the results combined into a 1,000-point satisfaction index.
J.D. Power also divided airports into Mega, Large and Medium categories. That methodology is important because the passenger experience at a huge international connecting hub can be fundamentally different from the experience at a smaller airport primarily serving local travelers. Comparing the two directly could create an advantage for airports with simpler passenger flows and fewer operational demands.
The results show a clear relationship between airport size and average satisfaction. Mega airports recorded a segment average of 617 points, compared with 657 for Large airports and 672 for Medium airports. Tampa International Airport (TPA), for example, led the Large category with 715 points, while Charleston International Airport (CHS) led the Medium category with 712.
MSP nevertheless stood substantially above the average for the most demanding size category. The Mega-airport average increased by 14 points compared with the previous year, yet Minneapolis–St. Paul remained far above that improving benchmark.

MSP’s Performance Highlights the Importance of the Airport Experience
The Minneapolis result also provides an important lesson about what travelers experience before they board an aircraft. Airlines frequently compete through cabin products, loyalty programs, lounges, schedules and fares, but passengers spend a significant part of their journey inside airport facilities that the airline does not completely control.
MSP has benefited from significant modernization work in recent years. Delta and the Metropolitan Airports Commission completed a $242 million modernization program involving six concourses in Terminal 1. More than 75 Delta gate areas received improvements including new seating, flooring, lighting, signage, flight-information displays and power access. The work occurred alongside a broader, long-term overhaul of passenger areas before security.
Those improvements matter particularly at a hub airport, where travelers may spend considerably more time navigating terminals and connecting between flights. Better signage, more accessible charging, improved seating and refreshed gate areas can influence perceptions even when the passenger’s actual flight experience remains unchanged.
The connection between airport infrastructure and airline strategy becomes even clearer when MSP is considered alongside other major Delta hubs. Detroit Metropolitan Wayne County Airport ranked second among Mega airports, while Salt Lake City International Airport (SLC) recorded 682 points. LaGuardia Airport (LGA), meanwhile, ranked fourth in the Mega category after undergoing a dramatic redevelopment.
Delta’s Hub Network Shows a Strong Ground Experience
The J.D. Power results become particularly interesting when the airport scores are examined across the major U.S. airline networks. Delta, American Airlines and United Airlines operate extensive hub systems, but their hubs do not all perform equally in passenger satisfaction.
An analysis matching the 2026 J.D. Power scores to the three airlines’ U.S. hubs and weighting those airports according to the amount of flying each carrier operates produces different results. The analysis gives Delta’s nine hubs a simple mean score of 638 and a flight-weighted mean of 636. American’s ten hubs produce a weighted mean of 614, while United’s seven hubs produce 602.
These figures are not rankings published by J.D. Power. They are an analysis based on J.D. Power’s airport results and airline departure volumes. The weighting is significant because it prevents a small hub from having the same influence as an airport where an airline operates hundreds of daily departures.
Delta’s result is particularly notable because its enormous operation at Hartsfield-Jackson Atlanta International Airport (ATL) pulls its overall figure downward. Atlanta scored 606 points, below the Mega-airport average. However, MSP’s 684 points, Detroit’s 663 and Salt Lake City’s 682 provide stronger scores elsewhere across the network.
American faces a different distribution of airport performance, with major operations at airports such as Dallas/Fort Worth International Airport (DFW) and Charlotte Douglas International Airport (CLT). United, meanwhile, has substantial exposure to Newark and Chicago O’Hare, which shared the lowest Mega-airport score at 585.
Minneapolis Investment Comes Before the Aircraft Cabin
The MSP result is particularly relevant as airlines increasingly pursue premium travelers. A passenger purchasing a premium cabin expects the experience to begin well before reaching the aircraft door. Airport access, security processing, terminal navigation, gate areas, lounges, concessions and connections can all influence the overall journey.
Delta’s investment at MSP is part of a broader strategy across its hub network. At LaGuardia, the airline invested $4 billion in a new Terminal C complex covering approximately 1.3 million square feet and containing 37 gates. The redevelopment included centralized passenger processing, expanded concessions and a major Sky Club.
Salt Lake City offers another example, with the airport approaching the completion of a $5.1 billion rebuild. Delta has also expanded its premium ground offering there, including a nearly 34,000-square-foot Sky Club with capacity for approximately 600 guests.
Detroit provides a different model because its McNamara Terminal has not undergone the same type of wholesale redevelopment. Instead, Delta has continued adding premium-oriented services and technology, including dedicated Delta One check-in facilities.
The combined picture does not establish that Delta’s investments caused its hubs to receive stronger passenger satisfaction scores. J.D. Power evaluated the airports, not the airlines operating within them, and many factors affecting passenger satisfaction are outside an individual carrier’s control. However, the results show a notable relationship between major infrastructure investment and strong passenger experiences at several important Delta gateways.
What MSP’s Third Consecutive Win Means for Travelers
For Minneapolis–St. Paul, the significance of the 2026 result goes beyond another award. MSP has now demonstrated sustained performance over multiple years while operating at the scale of a major U.S. connecting hub. Its latest score also came as the broader Mega-airport segment improved, making the achievement more than simply a consequence of other airports performing poorly.
The airport’s 684-point score, its 21-point advantage over Detroit and its 67-point lead over the Mega-airport average underline the strength of the result. More importantly, its first-place finishes across all seven measured dimensions suggest that travelers’ satisfaction is not concentrated in one isolated feature.
The wider airport rankings also reveal how different the passenger experience can be across major U.S. gateways. Tampa led the Large category with 715 points, while Charleston led Medium airports with 712, demonstrating that the highest overall scores are not necessarily found at the largest facilities. At the Mega-airport level, however, MSP’s continued performance places it at the front of a category defined by some of the most complex and heavily used airports in North America.
For Delta, the results provide another example of why the airport environment matters to an airline’s overall customer proposition. For Minneapolis–St. Paul, they establish a remarkable run of consistency: three consecutive J.D. Power Mega-airport victories, four wins in five years, and a first-place position in every measured satisfaction dimension in 2026.