Definitions
Plot: A plot is a target report generated from the digital integration of received echoes (PSR) or replies (SSR) within the antenna beamwidth. The PSR report provides range and bearing information, while the SSR report includes the Mode 3/A identity code and the Mode C decoded altimeter height value.
Track: A track is a target report that results from correlating a series of radar-reported positions for a single aircraft using a specialized algorithm. This report typically contains smoothed position and speed vector data.
Plots
Plots are derived from surveillance data through a plot extractor, which processes raw data from surveillance sensors. The plot extractor must differentiate target data (aircraft) from:
-
Ground clutter (terrain, buildings, etc.)
-
Weather clutter (clouds, precipitation, etc.)
-
Other objects (e.g., flocks of birds)
-
Noise (both internal and external)
Depending on the sensor, plots can be primary (from a PSR), secondary (from an SSR/MLAT), or combined (when both primary and secondary plots originate from the same aircraft). Primary plots typically provide only 2-D position information, unless the radar can determine target altitude, which is rare in civilian air traffic services (ATS). Secondary plots add SSR code and aircraft altitude when Mode C information is available.
Tracks
Combining plots into a track is known as tracking. The system examines consecutive scans, and if the necessary criteria are met, it declares that the data comes from the same aircraft. Tracks can be primary, secondary, or combined, depending on the sensor. They can also be mono- or multiradar based on the number of sensors used. Monoradar tracking uses data from a single radar to create tracks, while multiradar tracking combines data from different sensors to produce a single track per target, enhancing reliability. However, it’s important to note that the track’s position on the situational display may not accurately reflect the aircraft’s actual position due to approximation and averaging. Thus, the distance between two tracks may not represent the real distance between the aircraft.
Tracks offer additional insights, such as:
-
Machine speed: An approximation of groundspeed calculated from changes in plot positions, available for all tracks.
-
Vertical speed: Calculated from differences in Mode C readouts across plots, available only for secondary and combined tracks.
-
History: The positions of previous plots, accessible for all tracks.
-
Predict vector: An extrapolated future position based on the assumption that the aircraft will continue flying straight at its current groundspeed, available for all tracks.
Air Traffic Management (ATM) procedures often rely on the sensor providing information about a specific track. Therefore, different symbols represent primary tracks, secondary tracks, tracks from specific radars, and ADS-B tracks.
Labels
Labels can be attached to both plots and tracks, but track labels generally contain more information. When correlated with a flight plan, track labels become more interactive, allowing controllers to input clearances issued to the aircraft. CPDLC (Controller-Pilot Data Link Communications) is often conducted using fields in the correlated label. It’s important to note that flight plans are correlated only with tracks, not plots.
Labels can be repositioned to avoid overlap. Some systems include automated decluttering features that rearrange labels without controller intervention. The contents of a label depend on the ATS system design, but certain principles guide their creation:
-
Labels should be concise, containing all essential information without unnecessary details. To achieve this, two versions of the label may exist: simple (basic information) and extended (detailed information). Switching between these requires minimal effort from the controller.
-
The most common shape for labels is a rectangle made up of several rows (usually between 2 and 5), with each row containing one or more data fields.
According to ICAO Doc 4444, labels must include information related to the aircraft’s identity (like the SSR code or callsign), typically placed in the top row and leftmost data field. Labels must also be visually linked to their corresponding track symbols using a line known as a “leader line” to help controllers easily identify which track the information refers to.
Additionally, ICAO Doc 4444 mandates that level information (pressure-derived) be displayed when available, usually obtained from a Transponder or Automatic Dependent Surveillance Broadcast (ADS-B). Information about climbs or descents is often shown with an arrow next to the level data.
While SSR codes may not always be visible, clear indications of emergency codes (7500, 7600, 7700) are displayed on the situational display. This can be done by showing the codes themselves or presenting a brief warning message above the aircraft label. Dedicated colors (like red) may highlight the code/message or the entire label to attract the controller’s attention.
Correlated labels can be displayed in various colors to aid controllers in maintaining situational awareness. For instance, labels for aircraft on frequency, those expected to enter an area of responsibility (AoR), and those instructed to contact the next sector may be color-coded differently. Labels for flights on frequency often feature interactive fields, enabling controllers to store and retrieve information about instructions given and facilitate coordination with colleagues or CPDLC communication.
Examples of fields include cleared level, estimated level at the AoR boundary, heading, speed or vertical speed instructions, and direct route clearance, though these can vary significantly between systems. Important procedure-related information, such as RVSM status, wake turbulence category, and RNAV capability, is often included.
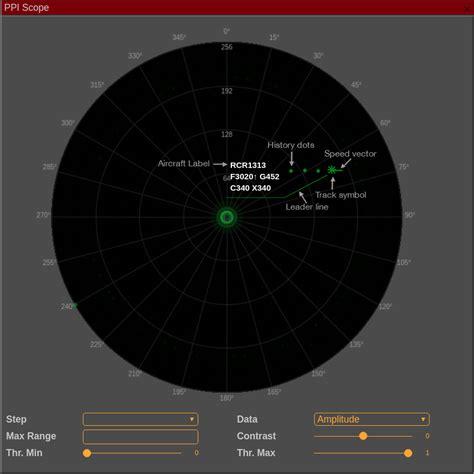
The illustration below shows a sample track and aircraft label featuring the callsign, current flight level, climb indicator (arrow), ground speed, cleared flight level, and exit flight level. This image serves as an example and is not intended to represent any real-life system.


 Frigate Program as Backbone of Trump’s Golden Fleet")


