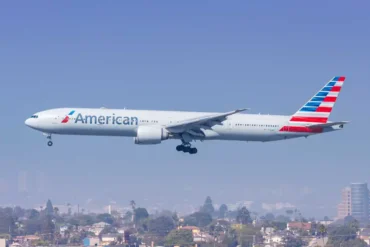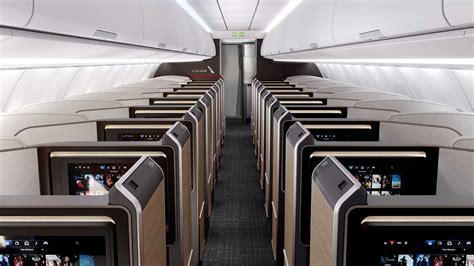
American Airlines’ longest flight is no longer a route to Tokyo, London, or any of the familiar long-haul strongholds that defined its international network for a generation. It is AA7, the nonstop service linking Dallas/Fort Worth International Airport with Brisbane Airport, a 7,216-nautical-mile (13,363-kilometer) haul that became the carrier’s flagship ultra-long-haul mission when it launched in 2024 aboard the Boeing 787-9. At first glance, the numbers look modest. The route does not even reach the extreme ranges that competitors now chase with specially built jets, and its destination is Australia’s third-largest city rather than its largest. Yet the economics behind AA7 explain far more about modern airline strategy than any headline-grabbing record could, because the route only genuinely starts to make money when American fills its forward cabin with 51 Flagship Suites, a configuration that arrived on this mission in October 2025 and transformed a thin-margin experiment into a premium revenue engine.
The Strategic Logic Behind American’s Longest Nonstop to Brisbane
The comparison with rivals is instructive before the revenue math even begins. United Airlines’ longest flight, UA 101 from Houston to Sydney, has been operating since 2018 with the Boeing 787-9. Delta Air Lines’ longest flight, DL 201 from Johannesburg to Atlanta, has flown nonstop since the late 2000s and now uses the Airbus A350-900. American, by contrast, arrived late to its own ultra-long-haul milestone, and AA7 is both the newest of the three flagship routes and the shortest, at 7,216 nautical miles. Being newest is not automatically being best, but it gave American the opportunity to design the product around the specific demands of a long, thin, premium-dependent market rather than inheriting legacy layouts shaped by a different era of demand.
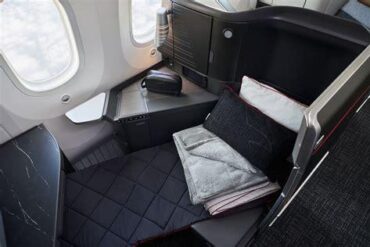
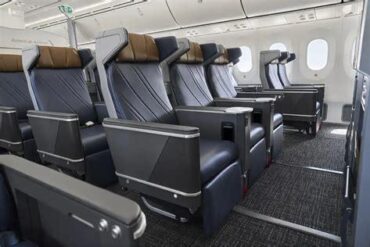
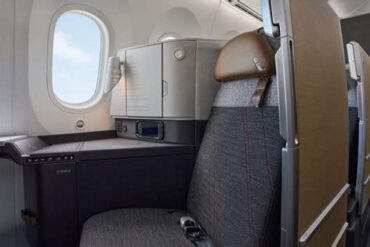
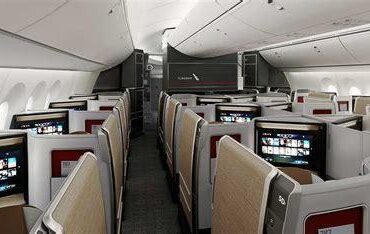
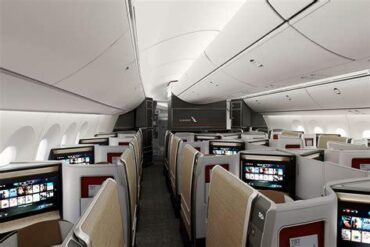
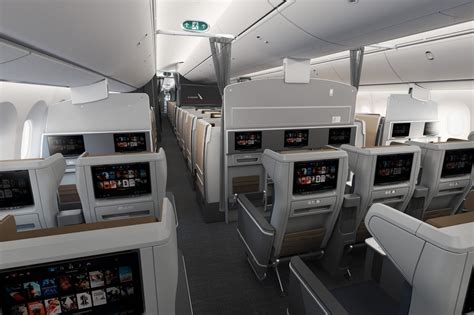
That timing matters because the aircraft itself was never the constraint. American has flown the Boeing 787-9 for nearly a decade, and the Dreamliner’s low operating costs and impressive range have made it the default tool for long, slender routes across the industry. What changed was not the airframe but the cabin inside it. The route could only be served profitably once American introduced its new 787-9 “789P” layout, which carries 51 Flagship Suites and 32 premium economy seats in a total cabin of just 244 passengers. The aircraft stayed the same; the revenue-per-square-foot calculation did not.
The choice of Brisbane is equally deliberate. Australia’s third-largest city sits behind Sydney and Melbourne, and American does not serve either of those on its own metal from DFW. That looks like an odd allocation of a scarce widebody until the network is viewed as a coordinated system rather than a collection of point-to-point lines. For an airline with one of the smallest widebody fleets among the global majors, every twin-aisle deployment is a bet that must be defended against a dozen alternative uses, and Brisbane won that internal competition for reasons that have as much to do with partners and subsidies as with passenger demand.
How the Qantas Joint Venture Frees American From Serving Sydney and Melbourne
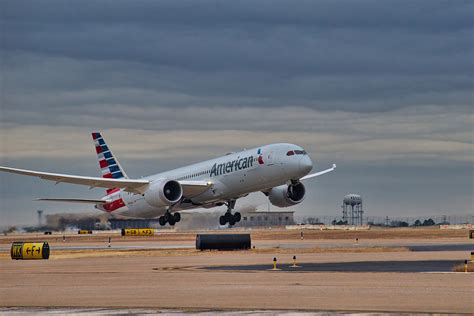
The Qantas-American Airlines metal-neutral joint venture is the structural foundation on which AA7 rests. Unlike a simple codeshare arrangement, this partnership allows the two carriers to coordinate pricing, align schedules, and share revenue on routes between the United States and Australia, effectively operating as a single airline across the Pacific corridor. American therefore does not need to duplicate Qantas’ presence in Sydney and Melbourne, because the joint venture already delivers those cities to American’s customers through Qantas metal, with seamless ticketing, coordinated connections, and pooled economics.
This is a meaningfully deeper relationship than the arrangements its rivals maintain. United holds a codeshare agreement with Virgin Australia, placing its code on selected Virgin Australia flights and selling tickets across each other’s networks. Delta relies on a looser interline agreement with Rex. Neither arrangement approaches the revenue-sharing neutrality of American’s Qantas partnership, and that difference directly shapes which cities each carrier must serve with its own aircraft. American can concentrate its scarce 787s on the one Australian gateway where its partner is comparatively thinner while Qantas handles the two largest markets.
Given Qantas’ established Brisbane operations and a schedule optimized around connections at DFW, the allocation becomes close to self-evident. American flies its own metal to Brisbane, funneling traffic through its most powerful hub, while Qantas carries the Sydney and Melbourne demand. The tradeoff is real: American surrenders direct control over the passenger experience on two major Australian routes and cedes revenue authority on those city pairs. In exchange, it avoids operating three ultra-long-haul services with a fleet it cannot spare, and it keeps its international exposure disciplined and conservative rather than aspirational.
Inside the 789P: Why 244 Seats Beat 285 on an Ultra-Long-Haul Mission
The arithmetic of route economics rests on two variables: revenue and operating cost. Ultra-long-haul flying inflates the second variable relentlessly, because fuel, crew time, maintenance cycles, and aircraft utilization all scale with stage length, and the margins that look healthy on a transatlantic service evaporate over twelve-plus hours of flying. When costs climb that steeply, revenue per flight becomes the deciding factor, and revenue per flight is driven by the mix of seats sold at premium fares. American’s original layout was extremely dense, ideal for leisure-heavy markets like Athens where volume matters more than yield, but poorly suited to a route where the marginal business traveler is worth several times the marginal leisure passenger.
| Airline | Aircraft | Business Class | Premium Economy | Economy | Total Seats |
|---|---|---|---|---|---|
| American Airlines | Boeing 787-9 (789) | 30 (11%) | 21 (7%) | 234 (82%) | 285 |
| American Airlines | Boeing 787-9 (789P) | 51 (21%) | 32 (13%) | 161 (66%) | 244 |
| Delta Air Lines | Airbus A350-900 (35H) | 40 (15%) | 40 (15%) | 195 (70%) | 275 |
| Delta Air Lines | Airbus A350-1000 | 53 (17%) | 48 (15%) | 213 (68%) | 314 |
| United Airlines | Boeing 787-9 (78P) | 48 (19%) | 21 (8%) | 188 (73%) | 257 |
| United Airlines | Boeing 787-9 (78L) | 64 (29%) | 35 (17%) | 123 (55%) | 222 |
| Singapore Airlines | Airbus A350-900ULR | 67 (42%) | 94 (58%) | N/A | 161 |
| Qatar Airways | Airbus A350-1000 | 46 (14%) | N/A | 281 (86%) | 327 |
| Qatar Airways | Boeing 777-200LR | 42 (15%) | N/A | 230 (85%) | 272 |
| Qantas | Airbus A350-1000ULR | 52 plus 6 First (24%) | 40 (17%) | 140 (59%) | 238 |
| Qantas | Boeing 787-9 | 42 (18%) | 28 (12%) | 166 (70%) | 236 |
The pattern across the table is unmistakable. Aircraft assigned to the longest missions consistently carry the highest proportion of premium seats. Singapore Airlines’ ultra-long-range A350-900ULR devotes 42 percent of its cabin to business class and 58 percent to premium economy, with no economy section at all. Qantas’ incoming A350-1000ULR allocates 52 business suites plus six first-class seats alongside 40 premium economy seats, leaving only 59 percent of the aircraft for economy passengers. United’s premium-heavy 787-9 layout offers 64 business seats, or 29 percent of its total capacity. American’s legacy 787-9, with just 11 percent business class, was an outlier among aircraft flying comparable distances.
The consequence of the old layout was a structural revenue leak. The small business cabin would regularly sell out, which sounds like success, but the total revenue it generated was insufficient to cover the disproportionate cost of the mission. Meanwhile the large economy cabin, priced competitively against Qantas and Asian carriers, also failed to generate enough revenue to close the gap. The result was an aircraft that flew full in the wrong cabins and left money on the table in the one cabin where ultra-long-haul margins actually live. The 789P flips that equation by removing 41 seats overall while adding 21 business suites and 11 premium economy seats, converting low-yield space into high-yield space.
American’s transition to the 789P on AA7 was not an afterthought. The aircraft entered service earlier in 2025, and the carrier began deploying it on the Brisbane route in October 2025, where it remains in service today. The route had originally launched with the standard 787-9, proving the mission was viable, and the premium-heavy configuration then unlocked the margins the route deserves. Few network decisions illustrate as cleanly how a cabin layout, rather than a new aircraft order or a new destination, can determine whether a long-haul service thrives.
Queensland’s Subsidies and Why US-Australia Flying Makes Financial Sense
Airports operate as for-profit entities, and new routes bring both direct business and broader economic benefits to the regions they serve. For decades that logic pushed airlines toward Sydney, with United adding Melbourne in 2014, because ultra-long-haul stage lengths demand concentrated demand to fill widebody aircraft. In the 2020s, however, the Queensland government began offering substantial subsidies to carriers willing to launch nonstop service to Brisbane, and the calculus shifted overnight. All three major US airlines have since responded, with United starting San Francisco to Brisbane in 2022, American launching DFW to Brisbane in 2024, and Delta adding Los Angeles to Brisbane in December 2024. Each route is commercially viable in significant part because of the public support backing it, which effectively de-risks the launch phase and improves load-factor thresholds.
Subsidies make the routes work even with moderate load factors, and the Brisbane service would likely have been profitable under American’s previous 787-9 layout, albeit with thinner margins that the 789P has since widened. The deeper logic, though, is fleet allocation. US airlines operate far more narrowbodies than widebodies, so every twin-aisle aircraft is a scarce asset that must be deployed where it earns the most, not merely where it might break even. Demand to Australia peaks during the Northern Hemisphere winter, precisely when European demand bottoms out, so Brisbane and similar destinations become especially valuable because they keep widebodies productive during months when transatlantic utilization would otherwise sag.
Lessons From American’s Chicago-to-Asia Retreat on Widebody Configuration
The clearest evidence that aircraft layouts determine route outcomes lies in American’s abandoned Chicago O’Hare Asia network. The carrier once served Beijing, Shanghai, and Tokyo Narita from O’Hare, initially with the Boeing 777, then largely downgauged to the 787-8 before cutting all three routes as unprofitable. The 787’s low operating costs should have been an advantage on long, thin routes, but American’s 787-8 layout offered only 20 Flagship Business seats and 28 premium economy seats out of 234 total seats. On routes to three of Asia’s largest business destinations, the airline was practically refusing to sell the cabin that mattered most.
| Aircraft | Flagship Business | Premium Economy | Economy | Total Seats |
|---|---|---|---|---|
| Boeing 787-8 | 20 (9%) | 28 (12%) | 186 (79%) | 234 |
| Boeing 787-9 | 30 (11%) | 21 (7%) | 234 (82%) | 285 |
| Boeing 787-9 (789P) | 51 (21%) | 32 (13%) | 161 (66%) | 244 |
Pricing pressure compounded the problem. Neighboring Asian carriers competed aggressively, and although supply influences fare levels, American could not extract a premium from travelers who had better alternatives on both price and product. Revenue barely materialized while operating costs on the long stage lengths remained stubbornly high. American’s widebody fleet has always been small next to United’s, which has long dominated trans-Pacific flying, and when the aircraft shortage met the revenue shortfall, the Chicago-Asia routes disappeared as American shifted its long-haul center of gravity to DFW, a fortress hub where it exercises far greater control over pricing.
This history reframes the 789P as a correction rather than a novelty. American spent years designing premium capacity out of its long-haul aircraft, and the market has now pushed it emphatically back in. Its newest 787-9s carry nearly as many Flagship Suites as the 777-300ER once did, the 777-300ER fleet is being refurbished with 70 Flagship Suites, and the 777-200ERs are slated to gain roughly 25 percent more premium seats, all because earlier configurations were leaving money on the table in a market where premium demand sits at an all-time high and American’s margins have trailed its closest competitors.
What AA7 Reveals About Selling Premium on the World’s Longest Routes
AA7’s real significance is the demonstration that premium cabin density is the lever that turns ultra-long-haul geography into profit. Fifty-one business suites, 32 premium economy seats, and 161 economy seats is not an elegant number; it is the result of a calculation that nobody else on this mission can make on American’s behalf. The Qantas joint venture removes the obligation to serve Sydney and Melbourne with American metal. Queensland’s subsidies reduce the launch risk. The Northern winter demand cycle keeps scarce widebodies working when Europe sleeps. But none of those advantages would matter if the aircraft still devoted 82 percent of its cabin to economy passengers on a mission where economy fares, squeezed by competitors and thirteen hours of flying, cannot carry the cost base.
The route also illustrates how network design operates far above the level of connecting dots on a map. The decision to fly to Australia’s third city was never about Brisbane’s market size; it was about the intersection of a partner’s strength, a government’s willingness to pay for connectivity, a seasonal demand mismatch, and a cabin that finally matches the economics of flying farther than American has ever flown. AA7 is the airline’s longest flight, but its value lies in what it proves about selling fewer seats more intelligently on the routes where distance makes every seat count.