International aviation has largely recovered from the disruptions of the early 2020s, yet not every route has benefited from the global rebound. Between April 2025 and March 2026, nearly 132.9 million passengers traveled on long-haul flights to and from the United States. Across almost 80 airlines, the average load factor reached an impressive 82.7%, highlighting strong worldwide demand. However, beneath these healthy industry-wide figures lies a very different story. Several long-haul routes consistently departed with hundreds of empty seats, recording load factors far below the global average.
A load factor measures the percentage of available seats occupied by paying passengers. While it is not the only indicator of a route’s financial health, it remains one of the clearest ways to understand whether airlines are matching capacity with demand. Cargo revenue, premium cabin sales, government incentives, and long-term strategic goals can all influence profitability, but persistently low seat occupancy often signals a route facing significant challenges.
The following routes, each carrying at least 4,000 round-trip passengers during the twelve-month period, represent the lowest-performing long-haul services connected to the United States. Some have already disappeared from airline schedules, while others continue operating with hopes that demand will eventually improve.
Why Some Long-Haul Flights Operate Nearly Empty
Launching or maintaining an international route is rarely based solely on immediate ticket sales. Airlines frequently accept lower passenger loads during the early stages of a new service, especially when expanding into untapped markets. Tourism authorities may also provide financial incentives, reducing the commercial risk while encouraging new visitor flows.
Seasonality plays an equally important role. Long-haul destinations often experience dramatic fluctuations throughout the year. A route may perform exceptionally well during holidays but struggle during quieter months such as February, traditionally one of the weakest periods for international travel.
Competitive pressure, limited connecting traffic, geopolitical factors, visa policies, airport connectivity, and aircraft scheduling can further reduce demand. Consequently, a weak load factor tells only part of the story, although some figures remain surprisingly low even after accounting for these variables.
The 10 Lowest Load Factor US Long-Haul Routes
The lowest-performing route recorded an astonishing 42.0% load factor. Air Tahiti Nui’s nonstop service between Papeete and Seattle-Tacoma International Airport averaged fewer than half its seats filled before the airline ended the route in January 2026. Despite connecting the South Pacific with the US Pacific Northwest, passenger demand simply failed to justify continued operations.
Second place belonged to Kuwait Airways, whose flights between Kuwait City and New York JFK achieved only 47.4% seat occupancy despite transporting more than 105,000 passengers throughout the reporting period.
Not far behind, Singapore Airlines recorded a 48.5% load factor on its Singapore–JFK operation. Because available government statistics do not clearly distinguish between nonstop services and one-stop operations via Frankfurt, interpreting the figure requires some caution. Nevertheless, the result remained unexpectedly weak for one of the world’s most respected premium airlines.
Fiji Airways filled just 52.2% of seats between Nadi and Honolulu, while United Airlines reached 52.7% during the inaugural season of its ambitious San Francisco–Adelaide service.
The remaining routes included three separate Ethiopian Airlines services from Addis Ababa to New York JFK, Atlanta, and Newark, alongside Delta Air Lines’ resumed JFK–Lagos operation and Saudia’s connection between Riyadh and Washington Dulles. Each recorded load factors hovering around 60%, substantially below the industry average.
United Airlines’ Bold Adelaide Gamble
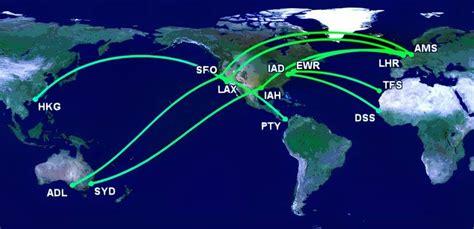
United Airlines entered unfamiliar territory when it inaugurated nonstop flights between San Francisco International Airport and Adelaide on December 11, 2025. The route marked the first-ever nonstop connection between North America and South Australia, making it a milestone for both tourism and regional connectivity.
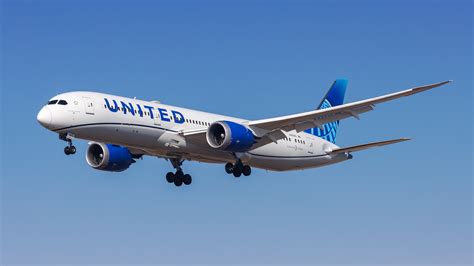
The service covered approximately 7,013 nautical miles (12,988 kilometers) each way using the Boeing 787-9, making it one of the carrier’s longest routes. Initially operating three weekly flights, the launch coincided with Australia’s summer holidays and the busy Christmas travel season.
Early results reflected the challenges of building awareness in a brand-new market. December performed reasonably well with a 68.5% load factor, benefiting from holiday travel. January declined to 58.9%, while February dropped dramatically to just 33.7%, meaning nearly two-thirds of available seats remained empty. March improved modestly to 53.9%, although still well below expectations for a sustainable international service.
Despite these disappointing figures, context matters. Airlines rarely expect immediate profitability from newly launched ultra-long-haul routes. Marketing campaigns, corporate travel agreements, and growing passenger awareness often require multiple seasons before demand stabilizes. United has already scheduled the route’s return for the 2026–2027 Australian summer, indicating continued confidence in its long-term potential.
Why Ethiopian Airlines Appears Three Times
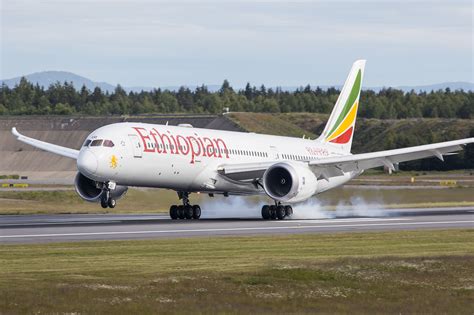
No airline featured more prominently among the weakest-performing routes than Ethiopian Airlines, which occupied three positions in the ranking. While this may initially appear alarming, operational realities explain much of the story.
Flights from Addis Ababa face unique performance limitations due to the airport’s high elevation. Aircraft departing with full fuel loads experience reduced takeoff performance, forcing many North American services to make intermediate stops for refueling and crew changes. Routes to Atlanta, for example, stop in Rome before continuing across the Atlantic, while return flights operate nonstop back to Ethiopia.
These additional stops reduce the attractiveness of the service compared with competitors offering nonstop flights. Furthermore, Ethiopian lacks a codeshare partnership with Delta Air Lines, significantly limiting connecting opportunities at Atlanta, one of the world’s busiest airports.
Passenger demand between Atlanta and Africa also remains relatively modest. Ethiopian depends heavily on travelers continuing beyond Addis Ababa to destinations across East and West Africa. While cities such as Lagos and Nairobi generate valuable connecting traffic, overall volumes have not been sufficient to consistently fill widebody aircraft.
Temporary suspensions during early 2026 also contributed to weaker annual performance figures.
When Low Load Factors Do Not Tell the Whole Story
Judging airline performance solely by seat occupancy can produce misleading conclusions. Some international routes generate substantial revenue through cargo transportation, particularly on flights linking manufacturing centers with North America. Premium cabin passengers also contribute disproportionately to profitability, meaning a half-full aircraft can still outperform a completely full flight with mostly discounted economy tickets.
Government support further complicates the picture. Tourism authorities frequently subsidize new international routes to stimulate economic development. Such agreements reduce financial risk during the critical launch period, allowing airlines additional time to establish passenger demand before evaluating long-term viability.
Consequently, while several routes in this ranking appear commercially weak, they may still serve broader strategic objectives extending beyond immediate ticket sales.
What These Underperforming Routes Reveal About Global Aviation
The list demonstrates that even in an era of record international travel, success remains highly route-specific. Strong overall demand cannot guarantee full aircraft on every city pair. Geographic isolation, limited local markets, insufficient connecting traffic, seasonal fluctuations, and operational constraints continue shaping airline network decisions.
Several routes have already disappeared, while others remain experimental investments intended to unlock future demand rather than immediate profits. Airlines constantly balance short-term financial performance against long-term strategic opportunities, making occasional low load factors an accepted part of international network development.
As airlines continue refining their global schedules, these surprisingly empty long-haul services provide valuable insight into the complexities of modern aviation. Behind every half-empty cabin lies a combination of commercial ambition, operational compromise, and calculated risk—reminding the industry that launching a new route is often only the first step toward building lasting passenger demand.


