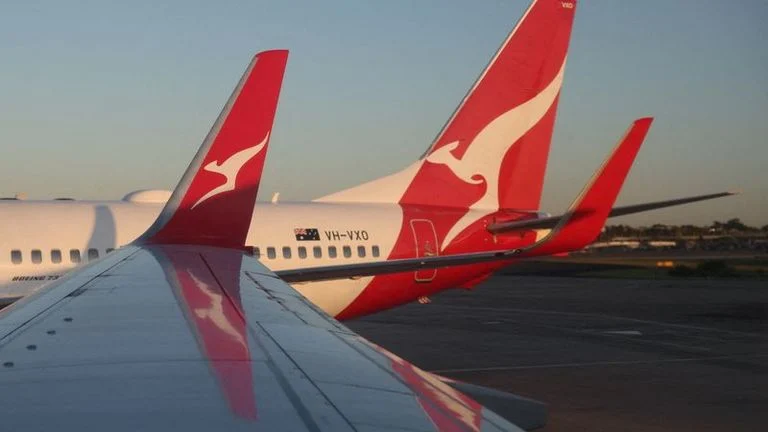
Qantas has long stood as a cornerstone of long-haul aviation between Australia and the United States, but recent data reveals a far more complex story beneath the surface. Despite carrying nearly 973,000 passengers across US routes, the airline’s average load factor of just 79.2% in 2025 signals underperformance in key corridors. Even more striking, several routes dipped significantly below that benchmark—one falling to just 66.8% capacity utilization.
These figures, drawn from US Department of Transportation data, expose a shifting landscape where demand, aircraft choice, competition, and network strategy collide. While Qantas still commands a 29% share of US–Australia/New Zealand traffic, its overall passenger volume has dropped 40% compared to its 2019 peak, underscoring structural changes in long-haul travel patterns.
Melbourne–Honolulu: The Weakest Link in Qantas’ US Network
The most underwhelming performer in Qantas’ US portfolio was the Melbourne–Honolulu route, which recorded a load factor of only 66.8%. Operated by the Airbus A330-200, this route struggled from the outset after launching in May 2025.
The timing of Qantas’ entry into this market proved challenging. Its low-cost subsidiary, Jetstar, had exited the route just a month prior—yet during its final year, Jetstar maintained a significantly stronger 87.2% seat occupancy. The disparity highlights a crucial reality: full-service and low-cost models attract fundamentally different demand profiles.
Qantas’ inability to replicate Jetstar’s success led to the route’s cancellation in January 2026. The airline has since redirected Hawaiian traffic through Sydney, a move designed to consolidate demand and improve profitability through hub efficiency.
Sydney–Los Angeles: High Volume, Surprisingly Low Efficiency
Despite being Qantas’ busiest US route, the Sydney–Los Angeles corridor ranked as the second weakest in load performance, with a 74.9% load factor. This route alone carried over 230,000 passengers, accounting for nearly 25% of Qantas’ US traffic.
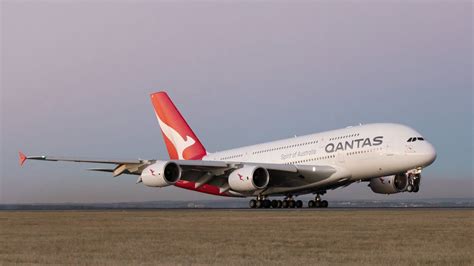
The paradox is striking: high passenger numbers but relatively low seat occupancy. The reason lies partly in capacity. Qantas operates this route daily using the 485-seat Airbus A380, one of the largest passenger aircraft in the world. While the aircraft offers unmatched capacity, it also demands consistently high demand to maintain efficiency.
Historically, this route was even more dominant. In 2009, Qantas operated up to three daily flights, deploying both the A380 and Boeing 747-400. Today’s reduced frequency and lower load factors reflect broader shifts in transpacific demand, as well as increased competition and evolving travel patterns.
San Francisco and New York: Premium Routes Facing Pressure
Trailing closely behind Los Angeles in load performance were Qantas’ routes to San Francisco and New York JFK. The Sydney–San Francisco route achieved a 76.2% load factor, while the Sydney–Auckland–New York JFK service reached 78.9%.
These routes are strategically significant, particularly the New York service, which represents one of the longest commercial flights in the world when accounting for its Auckland stopover. However, their relatively modest load factors suggest demand fragmentation, where passengers increasingly favor alternative routings, airlines, or stopover hubs.
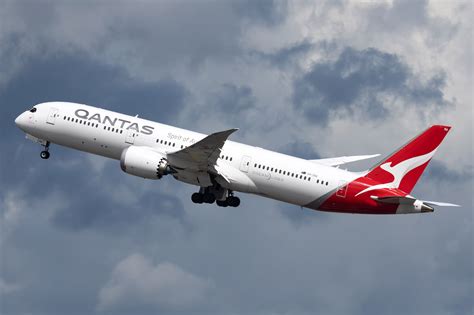
The Boeing 787-9, which operated 62% of Qantas’ US flights, plays a key role here. Its smaller capacity compared to the A380 allows for more flexible deployment, yet even these aircraft are not immune to underfilled cabins.
Melbourne and Brisbane Connections: Stable but Not Strong
Further down the list, routes such as Melbourne–Los Angeles (80.7%) and Brisbane–Los Angeles (80.7%) delivered slightly stronger performance but still lagged behind global long-haul averages.
These routes benefit from strong origin-demand traffic but face limitations in connectivity compared to Sydney. As Australia’s primary international hub, Sydney captures a disproportionate share of premium and connecting passengers, leaving secondary cities with thinner margins.
Dallas/Fort Worth: A Case Study in Strategic Partnerships
Qantas’ services to Dallas/Fort Worth—both from Sydney and Melbourne—demonstrate the critical importance of alliances. With load factors of 82.5% and 81.9% respectively, these routes rely heavily on connections facilitated by American Airlines.
More than 70% of passengers on the Melbourne–Dallas route connected onward to other US destinations. Cities like Toronto, Orlando, Chicago, and Boston formed the backbone of this demand. Without these connections, the route would likely be unsustainable.
The flight itself, lasting up to 17 hours and 45 minutes, ranks among the longest nonstop services globally. Its viability underscores how network integration—not just point-to-point demand—defines modern long-haul success.
Honolulu from Sydney: A Relative Bright Spot
While Honolulu from Melbourne underperformed, the Sydney–Honolulu route achieved a comparatively stronger 83.3% load factor, making it the best among Qantas’ weakest-performing US routes.
This route benefits from Sydney’s larger catchment area and stronger tourism demand, particularly from leisure travelers seeking direct access to Hawaii. It also highlights how geography and hub strength can dramatically influence route performance.
A Broader Decline in Transpacific Demand
Perhaps the most telling insight is not individual route performance but the broader decline in transpacific travel. The Sydney–Los Angeles market, once a powerhouse, carried 733,000 passengers in 2025, far below its 2011 peak of nearly 1.1 million.
Qantas’ market share on this route has also slipped to 31%, reflecting intensified competition and shifting traveler preferences. Yet load factors alone do not tell the full story. Pricing strategies, premium cabin demand, and cargo revenue all play critical roles in determining route profitability.
What Qantas’ Emptiest Routes Really Mean
The data paints a nuanced picture. Qantas is not simply struggling—it is adapting to a new reality where demand is less concentrated, competition is fiercer, and efficiency depends on precision rather than scale.
Aircraft choice emerges as a decisive factor. The Boeing 787-9, with its lower capacity and superior economics, aligns more closely with current demand patterns than the A380. Meanwhile, partnerships—particularly with American Airlines—have become indispensable in sustaining ultra-long-haul routes.
Ultimately, the story of Qantas’ emptiest US routes is not one of decline, but of transformation. In an era where every seat, connection, and frequency must justify itself, even the world’s most iconic airlines are being forced to rethink how they cross the Pacific.


