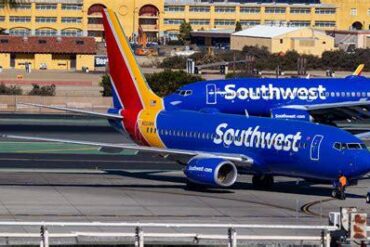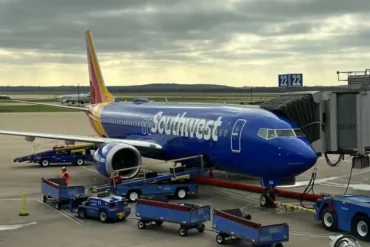
Southwest Airlines has built its reputation around a broad domestic network, frequent departures, and an unusually strong presence at several major U.S. airports. Yet even at its five busiest airports, some routes have struggled to attract enough passengers to fill the aircraft consistently. Between June 2025 and May 2026, the weakest eligible routes recorded load factors ranging from just 52.1% to 61.9%, far below Southwest’s network-wide average of 77.4%.
The five airports examined are Denver International Airport (DEN), Harry Reid International Airport (LAS), Baltimore/Washington International Thurgood Marshall Airport (BWI), Chicago Midway International Airport (MDW), and Dallas Love Field (DAL). Together, they represent an enormous portion of Southwest’s operation. OAG data indicates that the airports collectively handled an average of around 2,020 daily aircraft movements in 2026, while more than half of Southwest’s services touched at least one of them.
A weak load factor does not automatically mean that a route is losing money. Airlines evaluate routes using several measurements, including fares, connecting traffic, stage length, aircraft utilization, and revenue generated per available seat mile. That distinction becomes particularly important here because several apparently weak routes carried tens or even hundreds of thousands of passengers during the 12-month period.
The Department of Transportation data provides a useful snapshot of where Southwest’s seats were hardest to fill. Across its entire network, the carrier achieved a 77.4% average load factor. Its five busiest airports performed differently: DEN reached 80.3%, LAS 80.0%, MDW 79.6%, DAL 76.3%, and BWI 75.7%. Against those figures, the weakest routes stand out dramatically.
Southwest’s 11 Lowest-Load Routes
The worst-performing market was BWI–Jackson–Medgar Wiley Evers International Airport (JAN), which achieved a remarkably low 52.1% load factor. Southwest carried 38,622 round-trip passengers on the route during the measured period, but the service was ultimately discontinued in March 2026.
The BWI–JAN story is more complicated than the headline number suggests. Southwest originally operated between the two airports from 1997 until 2013, later returning to Jackson in 2021. During its second attempt, the airline carried 290,411 passengers overall but filled only 64.3% of available seats. In the final measured year, performance deteriorated sharply.
Other services from JAN performed better. Southwest’s links from Jackson to Houston Hobby (HOU) and Nashville (BNA) recorded load factors of 64.8% and 69.0%, respectively. The BWI service also generated a lower stage-length-adjusted yield than those alternatives. With fewer than one-quarter of JAN passengers connecting onward through BWI, the route lacked an especially compelling network role. Its eventual removal therefore looks less surprising than its five-year survival.
The second-lowest performer was Dallas Love Field–Midland/Odessa, with a 55.7% load factor and 229,616 round-trip passengers. The Texas market was followed by Chicago Midway–Tulsa, which reached 59.2% with 78,892 passengers. These figures illustrate the sheer scale of Southwest’s capacity problem on certain routes: even when a market attracts substantial passenger numbers, an airline can still struggle when aircraft provide more seats than demand can consistently absorb.
Denver–Midland/Odessa recorded a 59.7% load factor, while Chicago Midway–Wichita reached 60.2%. The latter deserves special attention because Southwest only began the route in March 2026. Its inclusion demonstrates why statistics must be interpreted carefully. A new route may require time to build awareness, establish habitual demand, and develop a stable schedule before its long-term performance becomes clear.
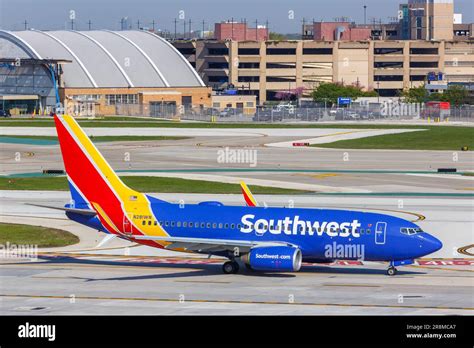
Another unusual case was Chicago Midway–Indianapolis, which achieved a 61.3% load factor. Southwest resumed the route in August 2025 after a five-year absence, meaning its first year back in the market was naturally influenced by the rebuilding of demand. Meanwhile, BWI–Raleigh/Durham also reached 61.5%, despite carrying an impressive 343,320 round-trip passengers.
The remaining weak performers were Dallas Love Field–Tulsa at 61.5%, Dallas Love Field–Austin at 61.8%, and Chicago Midway–Louisville and Chicago Midway–St. Louis, both at 61.9%. At first glance, these numbers look surprisingly poor for markets connecting major cities within relatively short distances.
Why Dallas–Austin Is Not as Bad as 61.8% Looks
The most interesting example may be DAL–Austin (AUS). The route carried 448,159 round-trip passengers between June 2025 and May 2026, making it Southwest’s 75th busiest route overall. Only 161,337 passengers traveled solely between Dallas and Austin, while 286,822 connected to another Southwest service at either airport.
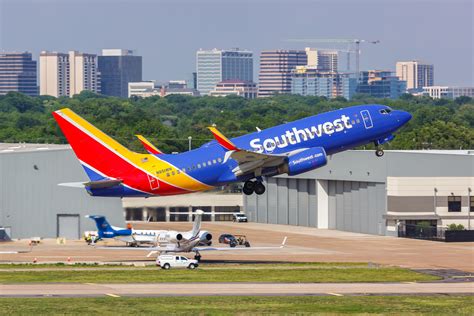
That connecting traffic changes the economics considerably. The route covers only 164 nautical miles, or about 304 kilometers, each way, and Southwest has operated it since 1977. Despite the 61.8% load factor, its stage-length-adjusted yield was the highest among Southwest’s DAL routes. It also ranked among the carrier’s top six for stage-length-adjusted total revenue per available seat mile.
That is why a low load factor should never be interpreted as a simple failure. An aircraft can depart with empty seats while still producing attractive economics if the passengers aboard pay strong fares or feed valuable connecting journeys. Southwest reportedly operates around seven daily flights in each direction on DAL–AUS, making the service useful for both local travelers and the wider network.
What the 11 Routes Reveal About Southwest
The biggest lesson from these figures is that empty seats do not tell the whole story. Southwest’s network is designed around connectivity, schedule frequency, aircraft utilization, and the strategic importance of its major airports. A route carrying fewer passengers may still serve an important purpose, while a seemingly busy route can become unattractive if yields remain weak.
The data also highlights how Southwest’s network is continually being reshaped. The BWI–JAN service has already disappeared, while newer markets such as MDW–Wichita need additional time to demonstrate whether their initial performance represents a temporary launch phase or a deeper demand problem.
Ultimately, Southwest’s 11 emptiest routes are less a story about empty airplanes than about capacity meeting demand in a highly competitive domestic market. A 52.1% load factor is undeniably striking, but the more revealing question is what each passenger contributes to the economics of the flight. That is where the difference between a genuinely weak route and a strategically valuable one becomes clear.