Flight delays are the modern traveler’s most persistent nemesis. They unravel itineraries, inflate travel costs, and test patience in fluorescent-lit terminals where time seems to stretch like tarmac in summer heat. While weather systems and congested airspace play their part, operational discipline and strategic planning often separate airlines that merely cope from those that consistently deliver. Recent data from the U.S. Department of Transportation’s Bureau of Transportation Statistics, covering March through October 2025, reveals a clear pattern: some carriers are far more likely to leave passengers waiting.
Measured by the percentage of delayed arrivals—defined as flights arriving 15 minutes late or more—five airlines stand out for the wrong reasons. By examining the ratio of delayed flights against total operations, rather than raw delay numbers alone, a more accurate picture emerges. High-volume airlines naturally accumulate large delay counts, but percentage performance exposes systemic friction within scheduling, fleet management, and contingency planning.
The following airlines recorded the highest delay percentages among major U.S. carriers during the period analyzed.
Frontier Airlines: The Highest Delay Rate in the U.S.
Frontier Airlines tops the list with a delay rate that significantly outpaces competitors. Out of 133,328 scheduled flights, 37,329 arrived late—an eye-opening 28% delay rate. In simple terms, more than one in four Frontier flights failed to land on time. The airline also recorded 2,111 cancellations, representing 1.58% of its schedule, the second-highest cancellation ratio among the carriers examined.
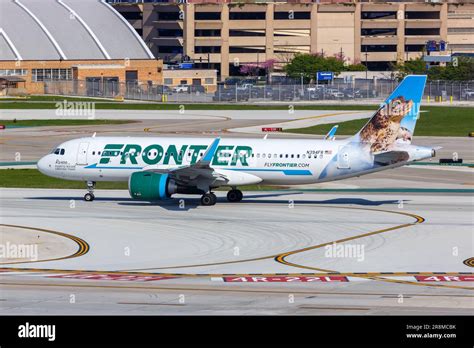
Frontier’s ultra-low-cost carrier model depends on razor-thin margins and maximum aircraft utilization. Aircraft are often scheduled for tight turnarounds, leaving minimal buffer when disruptions occur. When one segment runs late, the ripple effect can cascade across the network. Adding spare aircraft or maintaining extra crew on standby would mitigate these disruptions—but doing so increases costs, directly conflicting with the carrier’s low-fare strategy.
Passenger compensation policies further distinguish Frontier from legacy competitors. In controllable delay situations—such as mechanical issues or aircraft damage—meal vouchers may be provided if delays exceed three hours. However, in uncontrollable scenarios like weather or air traffic control restrictions, compensation typically does not extend beyond rebooking. Refund eligibility aligns with federal regulations, but additional amenities such as hotel stays are not standard practice. For travelers prioritizing budget over schedule certainty, this trade-off is implicit in the ticket price.
JetBlue Airways: Fleet Uniformity, Systemic Risk
JetBlue ranks second, with 38,117 delayed flights out of 155,432 total operations. That equates to a 24.52% delay rate, placing nearly one in four departures behind schedule. The airline also logged 1,885 cancellations, accounting for 1.21% of flights.
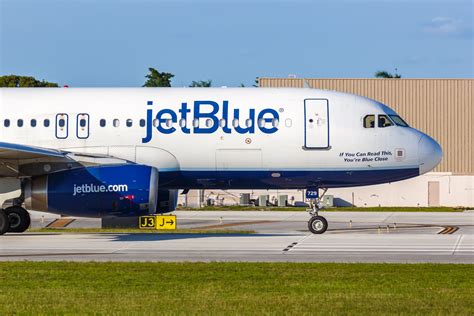
A notable contributing factor in 2025 was an emergency software update affecting Airbus A320-family aircraft. JetBlue operates an all-Airbus fleet, a strategy that simplifies maintenance and training but concentrates technical vulnerability. When a systemwide update became necessary following an in-flight incident involving uncommanded descent linked to solar radiation interference, disruptions multiplied rapidly.
Fleet uniformity can be operationally elegant, yet it also amplifies systemic risk. If one aircraft type encounters regulatory or software complications, the entire schedule absorbs the impact. Diversified fleets can isolate such events; uniform fleets magnify them.
JetBlue’s customer accommodation policies provide flexibility for delays exceeding three hours domestically or six hours internationally. Fee waivers and refunds are available under qualifying conditions, including weather-related disruptions and itinerary changes. Even so, a delay rate approaching 25% suggests structural scheduling stress rather than isolated incidents.
American Airlines: Massive Scale, Massive Disruptions
American Airlines is the only “Big Three” legacy carrier to appear in this ranking—and its scale makes the numbers striking. Out of 1,363,530 flights during the period reviewed—the highest among U.S. airlines—333,396 arrived late. That translates to a 24.45% delay rate, closely trailing JetBlue. The airline also led in cancellations, with 28,204 flights scrubbed, or 2.07% of its total schedule.
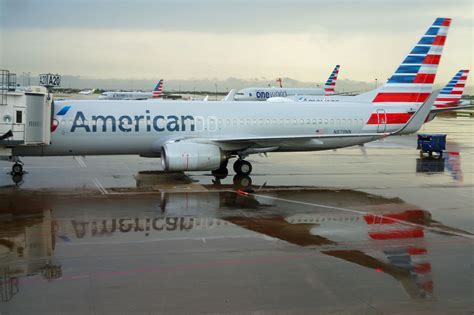
Large networks introduce logistical complexity. American’s extensive hub-and-spoke system funnels passengers through major airports such as Dallas/Fort Worth and Charlotte, where weather, congestion, or minor mechanical setbacks can propagate systemwide delays. When one inbound aircraft arrives late, dozens of outbound connections may be affected.
The airline has reportedly tested AI-driven rebooking systems designed to proactively adjust connecting flights when inbound delays threaten onward travel. By automatically modifying downstream schedules, the system aims to reduce missed connections and manual rebooking congestion. While such measures reflect innovation, their necessity underscores the magnitude of operational strain.
For airline-controlled overnight disruptions, American provides hotel vouchers and transportation, along with meal vouchers for extended delays. However, as with most U.S. carriers, weather-related events typically limit compensation to rebooking without additional amenities. The sheer scale of American’s network means that even marginal inefficiencies translate into hundreds of thousands of delayed travelers.
Allegiant Air: Budget Fares, Persistent Delays
Allegiant operates a comparatively small network but still posts one of the highest delay percentages. Of its 91,015 flights, 22,210 were delayed, yielding a 24.40% delay rate. Notably, Allegiant reported just 238 cancellations—0.26% of flights—the lowest cancellation ratio among the five airlines.
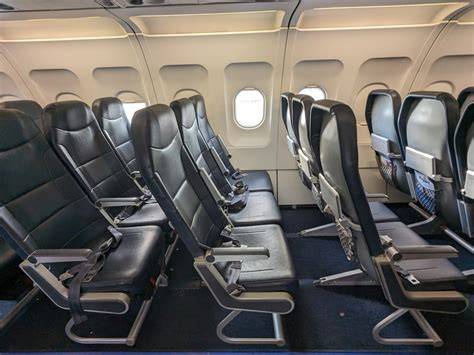
Allegiant’s business model focuses on connecting smaller regional airports with leisure destinations. These routes often operate only a few times per week, reducing frequency but increasing aircraft utilization on active days. When an aircraft experiences maintenance issues or arrives late, limited schedule redundancy leaves few recovery options.
Unlike legacy carriers, Allegiant generally does not provide hotel accommodations, meal vouchers, or alternate transportation for delays. Passengers can rebook or cancel for refunds on unused segments, but additional compensation is rare. The airline encourages travelers to consider third-party travel insurance to offset potential disruption costs.
The low cancellation rate suggests that Allegiant prioritizes operating flights even if departures are delayed. From a statistical standpoint, fewer cancellations improve reliability metrics. From a traveler’s perspective, waiting hours in a regional terminal may feel less reassuring.
Southwest Airlines: High Volume, Elevated Delay Exposure
Southwest Airlines, long celebrated for pioneering the low-cost carrier model, scheduled 954,366 flights in the period analyzed. Of those, 211,262 were delayed—producing a 22.14% delay rate. Cancellations totaled 5,602, representing 0.59% of operations.
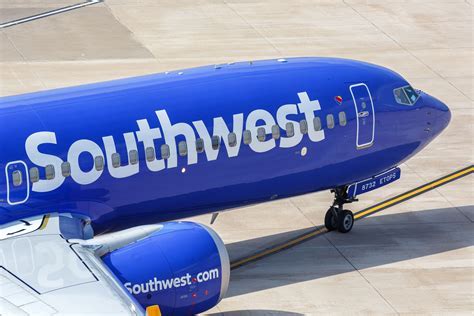
Southwest’s single-aircraft-type strategy—relying exclusively on the Boeing 737—streamlines pilot training and maintenance but shares some risk characteristics with JetBlue’s uniform fleet model. Operational simplicity reduces certain inefficiencies, yet network disruptions can still ripple rapidly across tightly scheduled rotations.
The airline’s cancellation rate remains relatively low, suggesting effective efforts to maintain continuity even amid schedule pressure. However, more than one in five flights arriving late signals persistent congestion or turnaround challenges within its extensive domestic network.
Unlike legacy competitors, Southwest does not routinely provide extensive delay compensation beyond what regulations require. Its focus historically centers on low fares and flexible ticketing policies rather than luxury amenities. Notably, onboard Wi-Fi is available for a flat fee per device, which can soften the inconvenience during extended airborne segments—particularly on long-haul domestic routes exceeding seven hours.
Why Delay Percentages Matter More Than Raw Numbers
Raw delay counts can mislead. An airline operating over a million flights will inevitably record high total delays, even if its overall punctuality is strong. Percentage-based evaluation normalizes performance and reveals operational efficiency. When delay rates cluster around or exceed 24%, systemic factors are likely at play.
Weather patterns during spring and summer months amplify disruptions, particularly in major hubs susceptible to thunderstorms. Yet weather alone cannot explain why certain carriers consistently underperform peers operating in similar environments. Scheduling density, fleet age, crew reserve ratios, and maintenance strategy all influence on-time performance.
Low-cost carriers often operate with lean staffing and minimal buffer capacity to maintain competitive fares. Legacy carriers, meanwhile, manage vast interconnected networks where one late inbound aircraft can affect dozens of subsequent departures. Each model contains structural vulnerabilities that manifest differently under stress.
The Broader Implications for Travelers
Flight delays are not random misfortunes; they reflect the complex interplay between economics, engineering, weather science, and human logistics. Airlines constantly balance cost control with operational resilience. Increasing spare aircraft or crew availability enhances punctuality but erodes profit margins. Reducing buffer times maximizes aircraft productivity but narrows recovery windows.
For travelers, understanding delay probabilities informs booking strategy. Early-morning departures typically face fewer cumulative disruptions, while hub-to-hub routes during peak hours encounter heavier congestion. Selecting nonstop flights reduces connection risk exposure, particularly when flying with airlines reporting elevated delay percentages.
Data transparency remains crucial. Public performance reporting enables passengers to make informed decisions and incentivizes carriers to refine operational discipline. When nearly one in four flights arrives late across multiple airlines, punctuality becomes a competitive differentiator rather than a baseline expectation.
Air travel remains statistically safe and remarkably efficient considering its scale—millions of flights navigating shared skies each year. Yet punctuality is where engineering meets economics. The numbers from 2025 make one fact unmistakable: while delays are an industry-wide challenge, these five U.S. airlines face disproportionate struggles in keeping travelers on schedule.