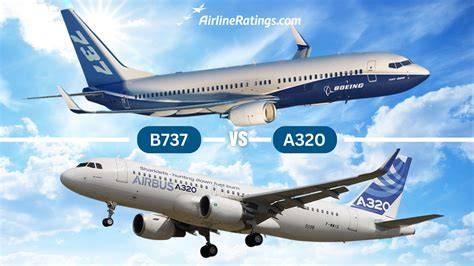
Narrowbody fleet decisions rarely hinge on glossy brochures or manufacturer talking points. They are settled in the finance department, where analysts slice operating data into fractions of a cent and ask a single, unforgiving question: which airframe delivers capacity more cheaply per seat? The Boeing 737 and Airbus A320 families are the two most commercially consequential aircraft families ever built, together carrying the overwhelming majority of the world’s short-haul passengers, and the contest between them has always been framed as a per-seat cost calculation. The operating metric at the center of that calculation is cost per available seat mile (CASM), which expresses the total expense of flying one passenger seat one nautical mile, roughly 1.85 kilometers. By compressing fuel, crew salaries, maintenance reserves, navigation charges, landing fees, and insurance into a single unit, CASM allows an executive board to compare an airframe’s ability to convert spending into sellable capacity rather than into prestige. In high-frequency single-aisle networks, where aircraft fly six, eight, or ten sectors a day, this metric behaves as a brutal equalizer. It strips away marketing hyperbole and exposes what an aircraft actually costs its operator on a Tuesday afternoon in the wrong kind of weather.
The pressure is immense precisely because narrowbodies are the workhorses of the global airline system. They dominate passenger volumes, generate the steady daily cash flow that keeps carriers solvent, and fly short sectors with brief turnarounds, so a variance of a single percentage point in per-seat efficiency compounds across thousands of departures and a twenty-year asset life. Network planners cannot evaluate either platform in isolation. They must model how a specific seating density, a specific stage length, and a specific asset value interact on the routes the airline actually flies, not the routes an analyst plotted in a spreadsheet. A carrier operating ten daily round-trips will feel a heavier empty weight or a layout that sacrifices eleven seats far more keenly than a carrier flying the same type twice a day on long domestic sectors. Everything sits inside that decimal-point volatility, and the airlines that manage it well are the ones whose fleets earn their capital back.
Fixed Ownership Costs Collapse at High Aircraft Utilization
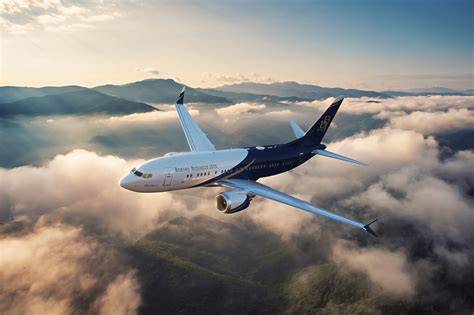
Managing the unit cost equation is fundamentally an exercise in balancing variable expenses against structural ownership costs. Direct operating variables, fuel and block-hour maintenance in particular, scale continuously with every hour the aircraft is aloft, which is why poorly utilized fleets drown in them. Fixed ownership costs, by contrast, behave very differently. Lease payments, debt service, and depreciation remain constant in absolute terms whether the aircraft flies eight hours a day or one, so the capital component of CASM falls dramatically as daily utilization rises, spreading the same fixed obligation across a much larger volume of seat miles. This is why airlines obsess over turnaround times, night curfews, and slot availability: every additional block hour amortizes an iron-clad monthly payment over more revenue-producing distance. When utilization drops during a downturn, the aircraft with the lower monthly capital charge suffers far less cash strain, which explains why the two manufacturers’ paper differences in acquisition price matter so much more than a rational first look suggests.
Never Believe the List Price of a Boeing 737 or Airbus A320
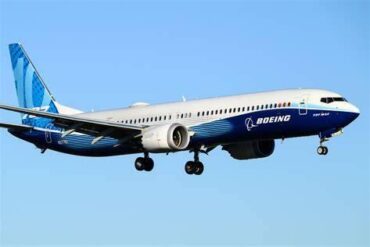
The capital side of the equation is also where public data diverges most sharply from private reality. Original equipment manufacturers publish catalog prices that serve as negotiation anchors rather than transaction values, and the headline numbers consistently favor Airbus. Boeing lists the 737 MAX 8 at approximately $117 million, while Airbus catalogs the A320neo at roughly $110.6 million, a gap that appears to hand the European jet a straightforward advantage. The secondhand and near-new market turns that relationship on its head. A nearly new A320neo has commanded market values near $58 million, while a comparable 737 MAX 8 has traded closer to $52 million, giving the American airframe a materially lower baseline capital cost per seat. That inversion is not a footnote; for budget carriers financing large-scale fleet renewals, it is the entire thesis. Lower acquisition or lease costs translate directly into lower fixed obligations per seat, which lets a low-cost operator price tickets more aggressively and still cover its cost of capital.
The practical value of that capital buffer becomes most obvious during economic volatility. Because the monthly obligation on a 737 MAX 8 sits structurally lower, an airline can park the aircraft, trim block hours, or absorb a seasonal collapse in load factors with less fiscal bleeding than a carrier locked into higher A320neo lease rates. Startups and expansion-minded operators find this particularly valuable, since every dollar not committed to fixed aircraft costs is a dollar available for pilot recruitment, airport slots, or the cash cushion that keeps a young airline alive through its first lean winter. The lower market value of the Boeing platform thus functions as an economic shield, one that protects cash reserves when passenger demand slips below optimal thresholds and gives management room to maneuver that a higher-priced asset simply does not.
Fuel Burn: Where the Airbus A320neo Wins on Fractional Efficiency
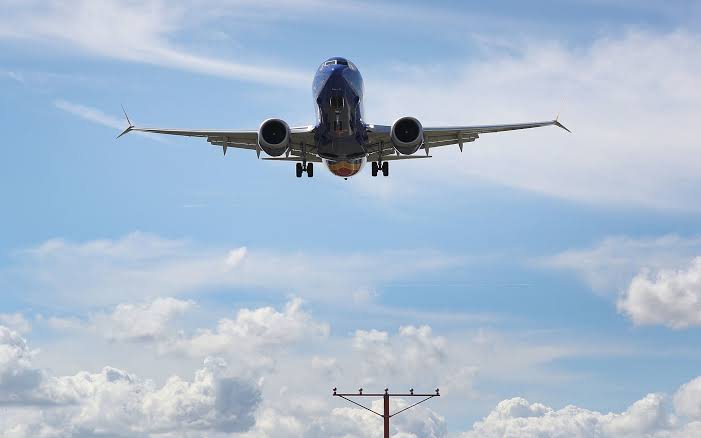
The Boeing airframe commands a distinct edge in capital asset pricing, but the operational equation swings firmly back toward the European consortium on thermodynamic fuel burn. Fuel is the single largest variable expense for any mainline carrier, frequently accounting for more than thirty percent of total direct operating costs, and both manufacturers responded to that exposure with next-generation powerplants built around ultra-high bypass ratios designed to extract maximum energy from every drop of kerosene. Under identical flight conditions, the A320neo demonstrates a fractional but remarkably consistent advantage in per-seat fuel efficiency. The European narrowbody burns approximately 0.594 US gallons per 62 miles (2.25 liters per 100 km) per seat, while the 737 MAX 8 consumes roughly 0.602 US gallons per 62 miles (2.28 liters per 100 km) per seat. Expressed in standard aviation terms, the A320neo achieves 0.682 nautical miles per gallon of fuel per seat, against 0.676 nautical miles per gallon for the 737.
These fractional deltas look negligible on a single sector, but they compound into substantial financial variation across a mainline fleet. Over a standard annual schedule of 3,000 block hours per airframe, the minor fuel advantage saves an operator tens of thousands of gallons per hull, and across a sub-fleet of one hundred aircraft that gap translates into millions of dollars of annual savings. This arithmetic explains why the Airbus platform remains strongly favored by legacy network carriers operating long stage-length routes, where fuel dominates the CASM calculation and every tenth of a cent per seat mile is fought over in fleet committee. On short sectors the advantage narrows, because a larger share of fuel is consumed in climb and taxi regardless of type, but on the long domestic sectors that define transcontinental and intra-European trunk routes, the European jet’s efficiency lead is real, persistent, and measurable.
Fuselage Geometry and Seat Density Decide the Per-Seat Equation
Engine efficiency sets the baseline for fuel burn, but the cross-section of a narrowbody fuselage determines how effectively an airline can dilute fixed operational costs across paying passengers. Cabin floor space and certified emergency exit limits translate directly into seat-mile economics, and here the two airframes diverge in ways that shape entire airline business models. In high-density single-class layouts typical of ultra-low-cost operators, the 737 MAX 8-200 accommodates up to 210 seats, whereas the A320neo is capped at 194 seats by door-exit limit regulations. Spreading identical flight deck expenses, navigation charges, and crew overheads across eleven additional revenue seats lowers the baseline unit cost per seat mile, allowing budget carriers to reach ticket price floors that a 194-seat configuration cannot match. Fitting 210 seats into the Boeing fuselage requires operators to reduce seat pitch to about 28 inches (71 cm) and install slimline lavatory modules close to the rear pressure bulkhead, squeezing every inch of usable cabin length.
The Airbus response is different rather than worse. Its fuselage measures 12 feet and one inch (3.70 meters) across, which permits wider 18-inch (46-cm) seats and noticeably faster boarding flows down the aisle. For low-cost airlines running high-frequency leisure routes, the mathematical benefit of eleven extra seats on every segment comfortably outweighs the marginal loss of pitch, which is why the MAX 8-200 exists at all. For full-service carriers, the calculus flips: passengers notice pitch, width, and boarding speed, and the A320neo’s slightly more generous interior can support a premium cabin and a more comfortable economy product that earns higher yields per passenger. Seat density is therefore never a neutral engineering fact. It is a strategic choice, and it determines whether an airframe competes on cost per seat or revenue per seat.
Stretched Variants: The Airbus A321neo Opens a Decisive Gap
Scaling the airframes upward alters the competitive balance decisively. As network carriers seek higher passenger throughput on slot-constrained trunk routes, the stretched variants become essential, and the operational data shows the gap widening firmly in favor of Airbus. The A321neo captures a definitive 3.5 to 4 percent CASM advantage over the competing 737 MAX 9. That widening stems from the A321neo’s superior payload-range capability and its Cabin-Flex door arrangement, which permits high-density configurations carrying up to 244 passengers compared with the 220-seat limit on the MAX 9. The additional twenty-four seats per departure, spread across the same trip costs of crew, navigation, and landing fees, is precisely the kind of leverage that reshapes a route’s profitability on a congested airport pair where extra frequencies are impossible.
Operators in mature markets have exploited that advantage relentlessly. Japanese carriers and U.S. airlines running transcontinental corridors routinely deploy the A321neo as a high-efficiency replacement for aging Boeing 757 fleets and smaller widebodies, carrying nearly 250 passengers at a fraction of the trip cost of a twin-aisle aircraft. The ability to move that volume through a single-aisle gate, with single-aisle turnaround economics, turns marginal routes into profitable ones and unlocks frequency on capacity-constrained airports. The important nuance is that the Boeing MAX 9 remains a highly prized asset in its own right. It is simply that on the stretched end of the narrowbody spectrum, where each added seat is diluted across fixed trip costs, Airbus holds a clear and durable economic advantage. Boeing’s lower capital pricing cannot close a gap of that size across a full asset life.
Fleet Commonality Decides the Winner More Than Any Specification
Single-airframe performance statistics rarely capture the full story of airline profitability, because the larger and more often conclusive financial factor is fleet commonality. For an established airline, introducing a second aircraft family requires enormous capital outlays long before any theoretical efficiency gain materializes: pilot cross-crew qualification, specialized maintenance tooling, duplicated simulator capacity, and split spare parts inventories across two supply chains. An operator managing one hundred 737s saves millions annually through unified crew scheduling and single-type maintenance pooling. Introducing a sub-fleet of A320neos to capture a one percent fuel advantage would immediately reintroduce millions in duplicate fixed overhead, plus the operational friction of retraining line engineers and ground handlers, destroying short-term margins and negating whatever per-seat savings were won in flight. The reverse applies just as forcefully to an all-Airbus carrier tempted by a lower Boeing market value.
That logic explains a striking pattern in airline procurement, where network, route stage length, and existing fleet architecture routinely outweigh the engineering deltas between the two manufacturers. Carriers like Southwest Airlines, Ryanair, and United Airlines have built their narrowbody strategy around one family and rarely deviate. The Airbus A320neo family retains a modest edge in fuel efficiency and a decisive advantage on stretched-variant unit economics. The Boeing 737 MAX family responds with lower real-world market values, a lower acquisition cost per seat, and higher maximum seating density on its core variant. In the end, cost per available seat mile between a 737 and an A320 remains so closely matched that the true economic winner is almost always decided by the network planners in the headquarters, optimizing schedules and seat maps for their own routes, rather than by the original equipment manufacturers in the factory. The best airframe is the one whose capital cost, seat density, and fuel profile fit the network an airline actually operates, and on most fleets that fit is determined long before the sales team arrives.